|
Published by Colabra Introduction
Effective communication skills are pivotal to success in science. From maximizing productivity at work through efficient teamwork and collaboration to preventing the spread of misinformation during global pandemics like Covid19, the importance of strong communication skills cannot be emphasized enough. However, scientists often struggle to communicate their work clearly for various reasons. Firstly, most academic institutes do not prioritize training scientists in essential soft skills like communication. With negligible organizational or departmental training and little to no feedback from professors and peers, scientists fail to fully appreciate the real-world importance and consequences of poor communication skills. The long scientific training period in the academic ivory tower is spent conversing with fellow scientists, with minimal interaction with non-technical professionals and the general public. Thus, the lingua franca among scientists is predominantly interspersed with jargon, leading to poor communication with non-scientists. This article will describe best practices and frameworks for professional scientists and non-scientists in commercial scientific enterprises to communicate effectively. How should scientists speak with non-scientists? IndustryThis section describes how professional scientists in industries like biotech and pharma can communicate better with cross-functional stakeholders from non-technical teams like sales, marketing, legal, business, product, finance, accounting, etc. Cross-functional collaboration In industry, scientists are often embedded in self-contained business or product teams with different roles. Taking a biotech product to market like a new drug, which has a long development cycle, involves extensive collaboration between specialists from multiple domains: research, quality assurance, legal and compliance, project management, risk and safety, vendor and supplier management, sales, marketing, logistics, and distribution, to name a few. Scientists are involved from the beginning of the process. However, scientists are often guilty of focusing solely on R&D without acutely considering how the science and technology underlying the product or business is operationalized by cross-functional teams and delivered to the market. Scientists are often less aware of the practical challenges of taking a drug prototype to the patient, such as long timelines due to multiple steps like risk management, safety reviews, regulatory approvals, coordination with pharmaceutical and logistics companies, and bureaucratic hurdles with governments and international bodies. This is a vital mistake in collaborative industry environments and often leads to poor job experience for scientists and their non-scientist peers and managers. The image below shows several communication challenges at the different stages of the drug development process that hinder successful commercialization. Although the various specialists share a common objective, each domain expert speaks a different “language” influenced by their respective training and fails to translate their opinions and concerns into a common language that all can understand. This comes in the way of optimal decision-making resulting in projects that stall even before demonstrating clinical efficacy. In an industry with a 90% drug development failure rate, poor communication and collaboration can be very expensive, to the tune of USD 1.3 billion per drug. The right culture is crucial to ensure successful outcomes, as advocated by AstraZeneca after a thorough review of their drug development pipeline. A recent real-world example pertains to the development of the AstraZeneca Covid-19 vaccine by multiple teams at the University of Oxford. Although the vaccine was developed within two weeks by February 2020, it was not until 30 December 2020 that the vaccine was finally approved for use in the UK, and it is even to date not authorized for use in the US. In particular, the AstraZeneca vaccine was subject to misinformation, fake news, and fear-mongering, which led to vaccine hesitancy and a lack of public trust. This led Drs. Sarah Gilbert and Catherine Green, co-developers of the vaccine, to author ‘Vaxxers,’ with the primary motivation to allay fears and reassure the general public about its safety and efficacy by explaining the science and process of creating the vaccine. Stakeholder management Another critical aspect of working with cross-functional teams involves managing key stakeholders to ensure a successful outcome for the project. Stakeholders often come from diverse non-scientific backgrounds, making working with them more challenging for scientists. The main challenge in effective stakeholder management is understanding the professional goals, metrics, and KPIs that drive each stakeholder. For instance, a product manager might focus on metrics like cost improvement over time, risk mitigation, or timelines; a finance leader may be focused on revenue; a compliance manager may be focused on metrics that capture safety and legal aspects. Understanding each cross-functional stakeholder’s north star can help scientists navigate the intricacies of stakeholder management. Effective stakeholder management involves numerous aspects: Identifying stakeholders The first step is to identify the stakeholders that are critical to the success of the scientific product and understand their motivations and priorities. Successful stakeholder management starts by mapping your stakeholders across several dimensions, including:
Aligning stakeholders Conflicting priorities among stakeholders are common and need to be resolved delicately. Achieving multi-stakeholder alignment for complex projects requires carefully planned discussions and negotiations to assess the lay of the land with each stakeholder and preempt potential conflicts. Focused group meetings that prioritize key points of disagreement or conflicting priorities can help achieve alignment and avoid conflicts. Engaging stakeholders After getting all the stakeholders aligned, it is useful to build a communication strategy to share project updates regularly. The communication plan must be tailored to each stakeholder. For example, individual contributors might need a high-touch approach, while project coordinators and administrators might just want periodic updates and high-level presentations. During the project's execution phase, continuous engagement and clear communication with the stakeholders are essential to keep everyone on the same page. Stakeholders may be involved in multiple biotech projects in parallel, and your project may not be their sole focus or priority. We have previously written about several modes of communication and project management apart from one-on-one meetings. At a minimum, it is beneficial to maintain a project status board detailing the progress of each milestone, metric, team, and timeline, especially to serve as a single source of truth, especially if some teams are working remotely. Entrepreneurship This section will discuss how aspiring startup founders with a scientific background should communicate and “sell” the company's mission to varied stakeholders from investors, employees, vendors, potential hires, and so on. Scientists with domain expertise and an entrepreneurial mindset are increasingly opting to build deep-tech startups soon after graduating from academia. From Genentech to Moderna and CRISPR Therapeutics to BioNTech, there is no shortage of successful biotech companies founded by scientists. However, building a commercially successful and viable biotech startup requires diverse skills with a much stronger need for excellent communication skills. Scientist founders need to have exceptional communication and sales skills to pitch the company to raise venture capital, write scientific grants, forge business partnerships with other companies, retain customers, attract talented employees with their vision for the company, give media interviews, and shape a mission-oriented organizational culture. Scientist-founders must communicate particularly well to bridge the gap between scientific research and commercialization. How should non-scientists speak with scientists? In this section, we will consider the viewpoint of non-scientists and how they can communicate more effectively with scientists. Non-scientists are typically more focused on product, business, sales, marketing, and related aspects of commercializing scientific research. The stakes for effective communication between scientists and managers are very high. This is best highlighted by NASA’s missions, which involve a diverse set of experts, both scientific and non-scientific, similar to the highly complex and multi-year projects described in the previous section. NASA’s failures on projects like the Columbia mission have been attributed to deficiencies in communication and insular company culture. Namely, management not heeding the scientists' and engineers’ warnings. These communication failures are expertly documented in a post-hoc report by the Columbia Accident Investigation Board – "Over time, a pattern of ineffective communication has resulted, leaving risks improperly defined, problems unreported, and concerns unexpressed," the report said. "The question is, why?" (source) Unfortunately, this state of affairs rings true even today in high-stakes and complex scientific enterprises. Here are some recommended tips that follow from such catastrophic mishaps and failures in workplace communication:
How can non-scientists better engage scientists? Non-scientist stakeholders' work largely focuses on business metrics, product roadmaps, customer research, project management, etc. These are critical focus areas that non-scientists need to update and communicate clearly to their scientist colleagues. In industry, it is common to observe scientist colleagues not actively participating in discussions focused on business topics and switch off until their work is the topic of discussion. It is crucial to engage scientists as they are on the front lines of core product development and in a better position to understand and flag potential roadblocks in manufacturing, commercialization, and logistics based on prior experience. Many product-related issues and bugs that surface later in the development cycle can be caught and addressed if there is more proactive communication between scientific and non-scientific teams. Scientists are generally trained to be conservative, focusing on accuracy and reliability, which can conflict with a manager’s ambitious goals for time-to-market or revenue targets. In these situations, managers should allow scientists to voice their concerns, not be afraid to dive deeper, coordinate with other cross-functional stakeholders, and take a balanced decision integrating every stakeholder’s views. In the long term, cultivating an open and progressive culture that encourages debates and tough discussions reaps enormous benefits whereby no business-critical concern is left unvoiced. A transparent and meritocratic culture promotes greater cooperation and understanding among different teams striving towards the same goals. Conclusion We discussed why scientists often struggle with effective communication with other scientists and non-scientist stakeholders when working in industry or building their own company. We addressed how scientists should approach communication with non-scientist colleagues and how to collaborate with them. We also discussed effective communication strategies from the perspective of non-scientists speaking to scientists. In the long run, having strong communication and soft skills confers greater career durability than simply having scientific and technical skills. Understanding this and upskilling accordingly can empower scientists to transition and perform well in industry.
Comments
Published by Unbox.ai Introduction
Supervised machine learning models are trained using data and their associated labels. For example, to discriminate between a cat and a dog present in an image, the model is fed images of cats or dogs and a corresponding label of “cat” or “dog” for each image. Assigning a category to each data sample is referred to as data labeling. Data labeling is essential to imparting machines with knowledge of the world that is relevant for the particular machine learning use case. Without labels, models do not have any explicit understanding of the information in a given data set. A popular example that demonstrates the value of data labeling is the ImageNet data set. More than a million images were labeled with hundreds of object categories to create this pioneering data set that heralded the deep-learning era. In this article, you’ll learn more about data labeling and its use cases, processes, and best practices. Why is data labeling important? Labeled data is necessary to build discriminative machine learning models that classify a data sample into one or more categories. Once a machine learning model is trained using data and corresponding labels, it can predict the label of a new unseen data sample. Data labeling is a crucial process as it directly impacts the accuracy of the model. If a significant proportion of the training data set is mislabeled, it will cause the model to make inaccurate predictions. Data labeling of production data is also important to counter data drift. The model can be continuously improved by incorporating the newly labeled samples from the real-world data distribution into the training data set. Poorly labeled data can also introduce bias in the data set, which can cause the models to consistently make inaccurate predictions on a subset of real-world data. Mislabelingcan severely impact the fairness and accuracy of models and warrants additional efforts to detect and eliminate labeling errors. Relabeling helps to address mislabeled samples, improving the data quality and, consequently, the accuracy of the machine learning models. How is data labeling performed? Again, data labeling helps train supervised machine learning models that learn from data and their corresponding labels. For example, the following text, sourced from the Large Movie Review Dataset, can be annotated in a number of ways depending on the use case: I saw this movie in NEW York city. I was waiting for a bus the next morning, so it was 2 or 3 in the morning. It was raining, and did not want to wait at the PORT AUTHORTY. So I went across the street and saw the worst film of my life. It was so bad, that I chose to stay and see the whole movie,I have yet to see anything else that bad since. The year was 69,so call me crazy. I stayed only because I could not belive it.........1. Use case: Sentiment analysis
For the named entity recognition use case, data annotators have to review the entire text and identify and label any mention of places. Typically, data annotation is outsourced to vendors who contract subject matter experts relevant for the specific machine learning use case. The team of annotators are assigned different batches of data to label on a daily basis for the duration of the project, using simple tools like Excel or more sophisticated labeling platforms like Label Studio. Labelers’ performance is evaluated in terms of metrics like overall accuracy and throughput—i.e., the number of samples labeled in a day. If the same set of data samples are assigned to multiple annotators, then the labels given by each annotator can be combined through a majority vote. Inter-annotator agreementhelps to reduce bias and mislabeling errors. For several use cases, data labeling can be extremely painstaking and time-consuming, which may lead to labeling fatigue. To counter this, labels assigned to each annotator undergo one or more rounds of review to catch any systematic errors. Once a batch of data is labeled, reviewed, and validated, it is shared with the data science team, who review select samples for labeling accuracy and verification and then provide feedback to the annotators. This iterative and collaborative process ensures that the final labels are of high quality and accuracy to use for training machine learning models. How is data relabeling performed? The repetitive and manual nature of data labeling is often fraught with errors. This necessitates the need to identify and relabel samples that were erroneously labeled the first time around. Relabeling is an expensive but necessary process as it is imperative to have a training data set of high quality. Unlike labeling, relabeling is usually done on a smaller sample of the entire data set and can be completed much faster if the samples are mislabeled in a unique way or associated with the same annotator. Once a trained model is deployed, its predictions on real-world data can be evaluated. A detailed error-analysis process can sometimes reveal systematic prediction errors. Many times, these characteristic errors may be correlated with a certain type of data sample or feature. In such cases, having another look at similar samples in the training data can help identify mislabeled samples. More often than not, labeling errors on a certain segment of the training data can be captured through such error analysis and corrected with relabeling. Best practices for data labeling Data labeling can be prohibitively expensive and time-consuming for large data sets. As model development is contingent on the availability of good-quality labeled data, poor labeling can affect the timelines and prolong the time to build and deploy machine learning models. A good practice for data scientists is to curate a comprehensive data-annotation framework for each use case before starting the data-labeling process. Clear, structured guidelines with examples and edge cases provide much-needed clarity for annotators to do their job with greater speed and accuracy. In the absence of domain experts within the company, external experts can be sought to discuss and conceptualize guidelines and best practices for labeling specific types of data. As labeling of large data sets by domain experts can be quite expensive, in specific cases, data labeling can be crowdsourced to thousands of users on platforms like Amazon Mechanical Turk. Typically, labeling by crowdsourced users is fast but often noisy and less accurate. Still, crowdsourcing can be a significantly quicker method of collecting the first set of labels before doing one or more rounds of relabeling to eliminate errors. Error analysis is another recommended practice to diagnose model prediction errors and iteratively improve model performance. Error analysis can be done manually by the data scientists or with greater speed and reproducibility using machine learning debugging platforms like Openlayer. Another good practice, in the context of very large data sets for deep learning applications, is to leverage machine learning to obtain a first pass of labels using techniques like the following: Conclusion Machine learning and deep-learning models are typically trained on large data sets. To train such models, a label for each data sample is necessary to teach the model about the information in the data set. Labeling, therefore, is an integral aspect of the machine learning lifecycle and directly influences the quality and performance of models in production. In this article, you’ve seen the importance, process, and best practices for efficient data labeling and relabeling. Mislabeled data samples introduce noise and bias in the data set that adversely impact the performance of the model. Identifying mislabeled examples through error analysis is a proven technique to improve the quality of training data that can be accelerated using machine learning debugging and testing platforms like Openlayer. Related Blogs
Published by Unbox.ai Introduction
Modern companies now unanimously recognize the value of data for driving business growth. However, high-quality data is much more valuable than data assets of poor quality. As companies accumulate petabytes of data from various sources, it becomes imperative to focus on the quality of data and filter out bad data. Data is the fundamental building block for predictive machine learning models. Although having access to greater amounts of data is beneficial, it doesn’t always translate to better-performing machine learning models. Sampling training data that passes quality checks and meets certain acceptance criteria can significantly boost the accuracy of the model predictions. In this article, you’ll learn more about why high-quality data is essential for building robust machine learning models, expanding on the various parameters that define data quality: accuracy, completeness, consistency, timeliness, uniqueness, and validity. You’ll also explore a few mechanisms you can implement to measure and improve the quality of your data. What is data quality? Data quality is a measure of how suitable the data is for its intended applications in data analytics, data science, or machine learning. There are several dimensions along which data quality is measured, which include the following:
Why is data quality important? Data quality is an important determinant of the quality of decision-making within an organization. Poor-quality data leads to inaccurate analytics and machine learning models, which might adversely impact various business operations as well as customer experience. Decisions and business strategies based on flawed data can have massive consequences. Typical data-quality issues include data security and data that is incomplete, duplicated, inconsistent, incorrect, missing, poorly defined, poorly organized, or stale. In the context of data science use cases, the consequences of using poor-quality data can be immense—machine learning models trained on low-quality data invariably generate weak or inaccurate predictions, which are not easy to troubleshoot. Deep-learning models in particular are very data-hungry, and their state-of-the-art performance is driven by the massive amounts of data on which they are trained. In this context, recent work has shown that training models with less data reflects real-world scenarios better and is increasingly becoming the norm. The cost of bad data to organizations is also enormous—as per an IBM study, the yearly cost of poor-quality data in the US alone is equal to USD 3.1 trillion. Therefore, it is paramount for organizations to invest in proper measurement and evaluation of data quality before building data-driven applications or devising new business strategies. Determining data quality Several organizations, from IMF to World Bank, have formulated Data Quality Assessment Frameworks (DQAF) to establish clear guidelines for measuring the quality of data in terms of accuracy, completeness, consistency, timeliness, uniqueness, and validity. This section will focus on each of these data-quality dimensions and discuss how they define the quality of data. Accuracy Accuracy, as the term implies, is a pivotal aspect of data quality—it means that the information is correct. Naturally, inaccurate information can cause many significant problems for a business. For instance, consider an example in which the time of financial transactions is incorrectly recorded due to a failure to update to daylight saving time. In such a scenario, the timing offset could lead to inaccurate analysis and reporting of core business metrics like daily sales and revenue. Such data inaccuracies can lead to potentially damaging consequences of incorrect financial and tax filings that could result in financial penalties by regulatory bodies. Completeness Completeness refers to how comprehensive the data is and whether it contains all the fields and values necessary to make them fit for the intended purpose. Incomplete data often contains empty or missing values across rows or columns and is unusable for further analysis. For instance, if a customer’s email address is missing, then this customer may not feature in any marketing campaigns, resulting in a potential loss of business for the company. Consistency Consistency is another fundamental trait of data quality, as it can affect the usage of the entire data set. If a data set has millions of records but some rows store a customer’s name as “CustomerName” while the remaining rows store the same information as “FirstName” and “LastName” separately, it might lead to inaccurate results and analysis. Another common example of inconsistent data is related to the underlying format or units of specific data fields. For instance, data like time is often kept in inconsistent formats, and units of money may be recorded differently from country to country. Timeliness Timeliness refers to how recent and up-to-date the information is. For a number of applications, timely data is essential as it captures the current trends and patterns in customer behavior or business health. Data tends to lose its value over time and can drastically affect the quality of business decisions as well as predictions from machine learning models trained on older data. It can cost organizations lost time and money, in addition to reputational damage. Uniqueness Uniqueness refers to the lack of duplication or overlap within a data set or across data sets. Modeling redundant information can often lead to spurious correlations or results that can adversely affect statistical analysis as well as model predictions. Thus, uniqueness is a critical dimension of data quality that is important to build trust in the data for downstream use cases. Validity For several data fields, validation checks are important. For instance, a mobile phone number is usually ten digits long, and zip codes in the US should have five digits. When data does not conform to standard formats or business-specific rules, it is said to be invalid. Invalid data can cause grave errors in downstream analytics and necessitates careful scrutiny of every data column before using it. Truncation of data also leads to data-validity problems. For instance, a user may mistakenly input six digits for a US zip code, which gets truncated to five digits. While such an input may pass data-validation checks, it is ultimately inaccurate. Additional sources of data-validity errors arise due to mismatched data formats. For instance, a data type like zip code may be inconsistently saved in numeric or string format. Improving data quality There are numerous methods for improving data quality. The first step often involves data profiling—that is, doing an initial assessment of the current state of the data sets. Defining what is good data is also critical to establishing guardrails around selecting data for further usage. Furthermore, a number of checks for data validation, completeness, consistency, and timeliness can be defined and have to be met by all current and new data sets. Data standardization across the organization helps to meet data-quality standards so that every stakeholder across different divisions has the same understanding of the various data sets and fields. Implementing a robust data governance framework can also help businesses improve the quality of organizational data. Finally, recent advances in machine learning and deep learning can also be used to identify and improve the quality of data in a more scalable and reproducible fashion. For example, in the deep-learning study, a data-quality assessment framework grounded in statistics and deep learning was used to identify outliers in a data set of salary information published by the state of Arkansas, USA. As the size of organizational data is bound to increase exponentially in the coming years, companies ought to allocate dedicated resources and investments in new techniques from fields like machine learning and deep learning to measure and provide statistical insights into the quality of their data. Conclusion In this article, you’ve learned what data quality is and why it is important for organizations to measure and evaluate the quality of their in-house data. Poor-quality data can have significant consequences for a business in terms of inaccurate analytics, predictive machine learning models trained on bad data, as well as ill-informed business decisions and strategies. Data quality can be measured in terms of a number of parameters such as accuracy, completeness, consistency, timeliness, uniqueness, and validity. Each of these data-quality dimensions are important, and organizations can improve the quality of their data by having robust data profiling, standardization, and validation checks in place. More recently, advances from machine learning and deep learning can also be harnessed to quantitatively define and evaluate the quality of data. Related Blogs
Published by Transform Introduction
A metric layer is a centralized repository for key business metric. This “layer” sits between an organization’s data storage and compute layer and downstream tools where metric logic lives—like downstream business intelligence tools. A metric layer is a semantic layer where data teams can centrally define and store business metrics (or key performance indicators) in code. It then becomes a source of truth for metric—which means people who analyze data in downstream tools like Hex, Mode, or Tableau will all be working with the same metric logic in their analyses. The metric layer is a relatively new concept in the modern data stack, mainly because until recently, it was only available to companies with large or sophisticated data teams. Now it is more readily available to all organizations with metric platforms like Transform. In this article, you’ll learn what a metric layer is, how to use your data warehouse as a data source for the metric layer, and how to get value from this central metric repository by consuming metrics in downstream tools. How a Metric Layer fits into a Modern Data StackThe modern data stack is composed of a number of elements organized in the order of how data flows:
One central benefit of a metric layer is that it sits between the data warehouse and downstream analytics tools. People can access metrics in business intelligence (BI) tools like Tableau, Mode, and Hex, bringing metrics consistency across all business analysis. Use cases for the Metric Layer The formulation and implementation of metric layers was pioneered by prominent tech companies like Airbnb, Spotify, Slack, and Uber. Airbnb designed a metric layer called Minerva to serve as a single source of truth (SSOT) metric platform. They did this by standardizing the way metrics are created, calculated, served, and used across the organization. Uber built uMetric, a standardized metric platform that underlies the entire lifecycle of a metric from definition, discovery, planning, calculation, quality, and consumption. These pillars not only enable rapid metric computation for business decisions, but also help create useful features for training ML models and promoting data democratization. A new component in the Modern Data StackWith the emergence of big data, predictive analytics, and data science, most companies have access to enormous amounts of valuable data. Many organizations have evolved their data stack to simplify computation, transformation, and access to key business metrics, which can accelerate data-driven decision-making. However, as Benn Stancil noted in his popular Substack blog, there was no central repository for defining metrics. This causes confusion and misalignment across an organization. "The core problem is that there’s no central repository for defining a metric. Without that, metric formulas are scattered across tools, buried in hidden dashboards, and recreated, rewritten, and reused with no oversight or guidance." —Benn Stancil, The missing piece of the modern data stack Another common issue is “dashboard sprawl” where metric logic is spread across different tools and data artifacts. Since this logic is different for every tool, teams often end up with different numbers for the same metrics and no one knows where to find the “correct” metric to answer their most important business questions. This problem led to the metric layer becoming a new artifact in the modern data stack. With a single shared store of metrics definitions and values, the metric layer ensures consistent and accurate analysis and reporting of metrics. A metric layer not only centralizes key business data but also helps improve the efficiency of data teams by removing the need for repeated analytics. This helps data stakeholders become key advocates and enablers of data-driven decision-making and data democratization across the entire organization. Reutilization of metrics in diverse contexts and external tools One of the benefits of having a single metrics repository is that it can be connected to a variety of tools; for example, CRM’s, BI tools, tools developed in-house, as well as data quality and experimentation tools. A centralized architecture ensures that no matter how a tool’s internal logic is configured, the end result will be based on the same metric logic and consistent across tools and applications. For instance, MetricFlow, the metric layer behind Transform, has an API that enables users to express requests for their Transform metrics directly within SQL expressions. Core metrics like Net Promoter Score (NPS), Monthly Recurring Revenue (MRR), Customer Acquisition Cost (CAC), loan-to-value (LTV), and Annual Recurring Revenue (ARR) capture the health of the business and need to be accurate for reporting and decision-making. With a metric layer, it’s possible to see the lineage of each metric, how it’s built, what the data source is, and how it’s consumed. By unifying metrics extraction and data analytics on these metrics, the metric layer provides the much-needed consistency that is lacking in modern data stacks. Enhancing transparency between technical and non-technical teams with a single interface A single interface for metrics information gives data stakeholders across an organization—in development, sales, marketing, and more—to have the same view and understanding of key metrics to track goals. This consistency allows all of these teams to speak the same language regardless of the tools they use to compute the metrics. This is a tremendous benefit of a metric layer and promotes stronger data democratization and governance across the entire organization. Transform is unique in that it has the addition of a metrics catalog on top of MetricFlow, its open source metric layer. The metrics catalog is a central location where both data teams and non-technical users can interact with, build context, collaborate on, and share key metrics. Tracking changes is easier Because businesses are constantly evolving and creating new metrics or changing the definition of existing metrics, each data stakeholder has to manually keep track of changes in a data warehouse to update their metrics definition and logic. However, with the combination of a metric layer and a metrics catalog, tracking changes metrics owners are alerted anytime the lineage or definition of a metric changes. This enables data stakeholders to make better sense of data, especially when a new metric definition leads to anomalous or unexpected results. Dig into the Metric Layer A metric layer reduces the problem of disparate results when the same metric is computed by different teams using a wide variety of BI tools. And it makes data-driven analytics more precise and promotes faster and more accurate decision-making. If you’re looking for a streamlined and centralized metric layer, MetricFlow is now open source. You can explore the project on Github. Find more information about Transform’s metric layer and its benefits in the product documentation. Related Blogs
Published by StatusHero Introduction
Teams are the building blocks of successful organizations. The success of modern technology companies is driven to a large extent by their engineering and product teams. It is crucial for new engineering and product team leaders to maximize the productivity of their respective teams while ensuring a strong sense of team spirit, motivation, and alignment to the larger mission of the company, as well as fostering an inclusive and open culture that is collaborative, meritocratic, and respectful of each team member. Effective team development and management is therefore critical for engineering and product leaders, and ensuring robust team development at scale remains a big challenge in the face of changing work conditions. Despite the importance of team building and development, not many leaders are trained to succeed and hone their leadership skills. In many cases, individual contributors who progress or transition to the managerial track may not have the aptitude for developing teams nor have the necessary experience or training in this vital aspect of their new role. Although team development is more an art than a science, this topic has received significant interest from the industry as well as academia, leading to structured team development theories and strategies. In this article, you’ll explore a list of curated tips for engineering and product leaders to better manage the development of your teams and accelerate your learning journey on the leadership track. This particular set of tips focuses on building team cohesion, facilitating the five stages of team development, and providing structures for effective teamwork and communication that foster an open and collaborative team culture. Regular Check-Ins One of the fundamental responsibilities of a team leader is to have periodic check-ins with team members, both individually and as a group. These meetings serve as an opportunity to assess each team member’s work performance, their attitude and motivation toward their respective projects, and even their sense of belonging and identity within the team and the organization at large. These regular one-on-one meetings with direct reports also help to bring to light any professional or personal concerns that the manager can then try to address, whether on their own or with the support of colleagues from the human resources department. Group meetings are also essential to allow team members to gather and discuss work issues as a group and voice any concerns that may affect the entire team’s output, productivity, efficiency, or morale. Such group meetings also provide a window for colleagues to learn more about the work and progress made by other members in the team, as well as provide a collaborative atmosphere in which they are encouraged to share their opinions or suggestions. Holding regular retrospectives is a great way to foster discussion and collaboration. As you can see, both individual and group meetings serve as a vital opportunity for team leaders to check the pulse of each member and the team as a whole to assess whether any interventions are necessary to uplift productivity and motivation. Sometimes, these kinds of meetings can be conducted as a retreat or simply at an off-site location to enable team members to bond in a fun environment and encourage more open communication about the team’s development and progress. Structured Work Team members benefit immensely from a high-level structure to guide their work and appropriately allocate their time and resources to the various projects they are involved in. Ideally, all employees should be assigned projects that suit their particular skill set and interests and should be empowered to take ownership for the success of their projects. With individual owners for each team project, the role of the manager is to simply serve each colleague in terms of offering strategic guidance, providing additional resources or bandwidth, and removing any technical or organizational blocks that may otherwise impede their progress. In addition to a clear and structured assignment of work projects, teams also benefit from having a structured work cycle. For instance, engineering teams usually employ an Agile methodology and a regular Scrum cycle to plan their work in sprints and evaluate their progress. Using these proven methodologies helps team members plan their work effectively and encourages feedback from colleagues and the managers to weigh into project planning and management. Over time, if these processes are followed diligently, teams become vastly more organized and productive, leading to more successful projects and deliverables. Five Stages of Team Development According to research by renowned psychologist Bruce Tuckman, there are five distinct stages in a team’s development. These include the following: Forming This is the first stage in a team’s development, in which team leaders introduce individual team members, highlight their respective experience and skills, and facilitate interactions among the team. Knowing each other’s core strengths helps team members better understand who to reach out to for help or collaborate with to execute their projects successfully. Ideally, this stage should be revisited each time a new colleague joins the team to ensure that they feel welcome and to stimulate effective onboarding. Storming Storming is the next stage in a team’s development, which involves team members openly sharing their ideas for current work or new projects in front of the entire team. Team leaders can facilitate this by organizing meetings or events such as hackathons. During this brainstorming stage, it is important that each individual is allowed to freely express their opinions even if they are in conflict with others’. This provides leaders an opportunity to provide high-level clarity and showcase their leadership by effectively resolving any conflicts and motivating team members to disagree and commit for the greater good of the team. Norming During this stage, the team has crossed the initial hurdles and resolved differing opinions, allowing them to begin to hit their stride and work more productively as a unit. With a clear roadmap and a better sense of team success, individual employees begin to celebrate each other’s strengths and weaknesses and collaborate more effectively. Team leaders should congratulate themselves for attaining the norming stage but also be aware of the need to maintain the team’s motivation and momentum toward achieving their goals. Performing By this stage, a team benefits from high levels of cohesion and trust in each other. Teams are more efficient and can self-sustain their progress and velocity with little oversight or push from the team leaders. This enables them to take on more challenging and audacious projects and push the team’s limits in a positive manner. During this stage, team leaders can step in to hone individual team members’ strengths and help them develop and strive for the next step in their careers. Sincere team leaders leverage their coaching and mentorship skills to empower individuals to progress toward their peak efficiency and realize their full potential at work. Adjourning By this stage, teams have completed their projects. This is an excellent opportunity to discuss what went well, what did not go so well, and how to improve and implement new strategies for future team projects. This is a good time to celebrate individual and team successes and to congratulate employees in a public forum, motivating them to strive for even greater success in the future. Team leaders should also take the feedback from the team and leverage it to improve their team building and development methods. Conclusion Developing teams of engineers and product managers is a critical responsibility for the leaders and managers of modern technology companies. When teams operate at their best, the organization as a whole benefits from their productivity and positive momentum. In this article, you’ve learned several tips and strategies on how engineering and product team leaders absorb and implement in their respective teams. These include conducting regular check-ins with individual employees as well as the entire team, providing a structured framework for carrying out their work and executing projects successfully, and following the principles from the five stages of team development. Essentially, leaders should strive to build a team where the whole is greater than the sum of its parts. This not only requires substantial care, attention, and efforts from the leaders but also a high level of empathy and understanding of each individual in the team. Teams with strong, empathetic, servant leaders rise above other teams in an organization, attracting better and more strategic projects and opportunities for collaboration, ultimately resulting in a win for every team member as well as the team leader. Published by StatusHero Introduction
Remote work has become increasingly common in the past few years. With seventy-six percent of employees saying they don’t want to be in the office full time, if at all, remote work is probably here to stay. But this type of work does have its disadvantages. Organizations face the challenge of virtual team building and maintaining the company culture, despite their teams being scattered across the globe. Fostering a strong sense of team spirit and camaraderie is essential for employees to feel connected to their work, their colleagues, and their employer. For remote teams, however, team-building exercises are often an overlooked essential activity. Platforms that are primarily used for team communication and collaboration, like Zoom, Slack, or Discord, can also be leveraged for fun and engaging team-building events. With remote work, employee interactions are often almost entirely work-related, without the usual water cooler break chats. Though this may potentially boost productivity, it will likely do so at the expense of team members’ morale and sense of belonging that’s fostered by casual, friendly interaction with their coworkers. In this article, you’ll learn about five 5-minute team-building activities that can help employees unwind, bring them together, and promote team cohesion. These activities can help employees share their fun, quirky sides, and offer everyone a bit of a break. Five 5-Minute Team-Building Activities While there are many great ways for your team to interact and do things together, this list can serve as a good starting point. It focuses on team-building activities that can be done quickly, with little or no preparation, but still offer plenty of opportunity for bonding, laughter, and understanding between teammates. Share Your GIF In this activity, everyone shares a GIF or a meme that represents how they feel, or how their weekend or previous day was. Websites like Giphy and Reddit are full of fun content that’s sure to elicit a laugh. This activity can be held in real time at the start of a weekly meeting, or asynchronously on Slack or Discord. You could even use it as part of a daily check-in. Why This Activity? If a picture says a thousand words, a GIF says even more. This activity helps employees express themselves, and maybe share a laugh. It can also provide conversational fodder for later, either with the whole group or in small, spontaneous groups on platforms like Slack. Virtual Hat In a virtual hat game, everyone adds one or more facts about themselves or brief anecdotes about their lives to a “hat” from which the facts will be drawn. For remote teams, the “hat” can be a simple shared Google doc. To play the game, someone reads one of the facts, and participants try to guess which of their teammates submitted it. The more unexpected or unlikely the anecdotes shared are, the more fun the game is. It’s similar to the game “Never Have I Ever”, and leaves people with a sense of amazement (or at least amusement) at some of the inspiring, unlikely, or just plain weird things people in the team have done in their past. You could also do a themed version of this, in which all the facts have to relate to a certain topic, such as past jobs, animals, work-related skills, or hobbies. Why This Activity? In a remote environment where work-related talk dominates, there aren’t many organic opportunities to share personal stories and let coworkers discover each others’ personalities. This activity often reveals unique traits and experiences, which can lead to more conversation between employees, give employees a better understanding of their coworkers’ skills, and even give managers a better idea of how employees might be able to grow within the company. #Dog-of-the-Day If you already use team collaboration software like Slack, Discord, or Teams, there are probably plenty of channels about work, but they don’t have to all be about work. Something like a #Dog-of-the-Day channel to allow people to share pictures of pets can really boost morale. Many corporations have dog-friendly policies for their physical office, and studies show that these reduce employee stress and improve employee engagement and retention—regardless of if the employee has a pet or not. Though studies haven’t been done on the effect of sharing pet pictures virtually, social media has plenty of people who feel it’s the best part of their day. Why This Activity? People love their pets—and most people love seeing other people’s pets, too. In remote settings, conversations are dominated by work-related messages and notifications, and pet photos can be a soothing break. It also offers something for employees to bond over, commiserating about dogs who demand to be walked at four in the morning or sharing pet-related hijinks and mishaps. Show and Tell Before your next team meeting gets going, take a few minutes to go around and offer people the chance to share something they’re proud of, happy about, or enjoying lately. These things might be physical objects they can actually show, like a sweater they’re knitting or their new keyboard, or less tangible things they can tell the team about, like having a great view of a recent meteor shower, finishing their first 5K, or the fantastic bread they made last weekend. Why This Activity? It’s nice to take a few minutes to recognize the things that are going well for your teammates, and to celebrate their victories, however small, with them. It also gives people an opportunity to learn more about their coworkers’ lives outside of work, and a chance to connect over shared interests that wouldn’t have come up otherwise. Daily Photos When everyone’s in the office together, people bond naturally and instinctively by complimenting someone on their new haircut, asking what that delicious-smelling lunch is, or grousing together about the lousy weather. With a team scattered across the country, if not the globe, this sort of casual, friendly interaction is much harder. It’s easy to work with someone for months or even years, and then realize one day that you don’t know anything at all about where they live, or what their life is like outside of work. Similar to #Dog-of-the-Day, a channel could be created for your team to share pictures from their lives: cute new shoes, a snowy morning, newly reorganized desk, or the first flowers of spring. Why This Activity? Sharing photos can be a great way to connect your team. It lets people share things that matter to them, and photos are an easy way to spark conversations about cooking, travel, gardening, hobbies, organization, and almost anything else people want to share. Conclusion Remote working is a challenge not only for the employees, but also for managers and leaders who care about creating a healthy, engaging work environment. Virtual work is dominated by work-related discussions, which can create fatigue and even burnout if not managed carefully. Fostering a sense of camaraderie and team spirit with fun and easy team-building activities helps boost morale, create friendly bonds between teammates, and make employees feel valued and respected as people, not just workers. Team-building activities can bring your team together, wherever they’re located—no office required. I receive several messages about the benefits of joining FAANG and similar companies and startups in the context of Data Science, Machine Learning & AI roles.
Here’s my take, in no particular order: 1. 𝐁𝐫𝐚𝐧𝐝. FAANG+ are not only the top technology companies but also the biggest companies by market cap -> great brand to add to your profile, top compensation and benefits. 2. 𝐒𝐜𝐨𝐩𝐞. The scope of AI/ML applications in these companies is tremendous as they have tons of data. You can get to work on multiple use cases, driven by statistics, machine learning, deep learning, unsupervised / semi-supervised / self-supervised, reinforcement learning etc. Internal team transfers facilitate expanding your breadth of ML experience. 3. 𝐁𝐚𝐫. The AI/ML work is cutting edge, as most of these companies invest heavily in R&D and create game-changing techniques and models. They also invest heavily in platform, cloud, services etc. that make it easier to build and deploy ML products. 4. 𝐑&𝐃. You can do both research on moon-shot projects if that’s your cup of tea, as well as more immediate business-driven data science projects with monthly or quarterly deliverables. 5. 𝐏𝐞𝐨𝐩𝐥𝐞. You get to work with the creme-de-al-creme in terms of talent, ideas, vision, and execution. Your own level will rise if you are surrounded by some of the brightest folks, and also get to collaborate with their clients and collaborators from academia, startups as well. 6. 𝐍𝐞𝐭𝐰𝐨𝐫𝐤. After FAANG, people go on to do many diverse things — from building a startup to doing cutting-edge research to non-profits to venture capital amongst others. You can find quality partners for the next steps of your career journey. 7. 𝐒𝐲𝐬𝐭𝐞𝐦𝐬. Processes and systems for AI/ML/Data are more mature and streamlined than smaller/newer companies which can facilitate your speed and execution of your projects. 8. 𝐂𝐮𝐥𝐭𝐮𝐫𝐞. The culture, on average, is more professional as these companies invest heavily in their employees and regularly come up with new employee-friendly policies to make it a great place to work. 9. 𝐅𝐫𝐞𝐞𝐝𝐨𝐦. After FAANG, you will be in demand and recruiters and hiring managers will seek you out if you’ve proved your chops whilst at the company. You will have more opportunities to sample from and greater freedom in terms of deciding your career and life trajectory, as you can also move internally to different countries. 10. 𝐈𝐦𝐩𝐚𝐜𝐭. Given the scale at which these companies operate, the scope for real-world measurable impact is enormous. There are some downsides, caveats and exceptions as well, but on average these factors make FAANG and similar tech companies a very attractive proposition to launch, build and grow your career in data science and machine learning. Introduction
"Data democratization" has become a buzzword for a reason. Modern organizations rely extensively on data to make informed decisions about their customers, products, strategy, and to assess the health of the business. But even with an abundance of data, if your business can’t access or leverage this data to make decisions, it’s not useful. To that end, data democratization, or the process of making data accessible to everyone, is quintessential to data-driven organizations. Providing data access to everyone also implies that there are few if any roadblocks or gatekeepers who control this access. When stakeholders from different departments—like sales, marketing, operations, and finance—are permitted and incentivized to use this data to better understand and improve their business function, the whole organization benefits. Successful data democratization requires constant effort and discipline. It’s founded on an organization-wide cultural shift that embraces a data-first approach and empowers every stakeholder to comfortably use data and make better data-driven decisions. As Transform co-founder James Mayfield put it, organizations should think about "democratizing insights, not data." In this article, I will provide a detailed overview of data democratization, why organizations should invest in it, and how to actually implement it in practice. Why democratize access to data? Historically, data used to be kept in silos, usually under the purview of the IT or Analytics departments. When any stakeholder from outside these departments required data for their work, they had to go through these data gatekeepers to access the necessary assets. This philosophy has been the norm for decades but is no longer relevant for modern data-driven organizations. Removing these types of bottlenecks is a necessary first step toward data democratization. Guidelines for data democratization can be noted in a data governance framework to improve access and provide high-quality data for downstream analytics. Improving access is just the first step of an ongoing process where every individual employee is encouraged and trained to make use of data. The more people who can make decisions based on data, the more the organization stands to benefit from a variety of perspectives and ideas. Companies have been dedicating huge investments in data infrastructure and tooling in order to build an analytics advantage over their competitors. The dream is to “democratize data” and get employees to change their ways of working and start making decisions informed by data, not gut feelings. By investing in data education and helping analysts influence, then building modern tools to support metrics, we will continue making progress toward that goal of truly democratized data" —James Mayfield, co-founder, Transform While data analytics and business intelligence efforts are traditionally the domain of data experts, organizations can empower non-technical stakeholders to perform basic data operations via in-house training programs, workshops, and self-service tools that can simplify their onboarding and learning process. They can also use software that surfaces data in an easy-to-consume format for business stakeholders. Data democratization has multiple downstream benefits. It leads to greater data literacy, which can facilitate not only greater data-driven decision-making but also potentially lead to creation of new products or services based on insights mined from the data. Therefore, greater democratization, usage, and adoption of a data-driven approach can unlock massive commercial value and new growth levers for businesses. How do you actually democratize data? Implementing data democratization is a hard challenge and an ongoing process. To be successful, it needs support, buy-in, and a lot of patience from the leadership. Apart from conceptualizing and implementing curated data governance frameworks and policies, organizations can leverage tools to enable data democratization at scale. Tools to enable data democratization The Data Catalog A data catalog is a collection of metadata that, combined with data management and search tools, helps data stakeholders find and acquire data for downstream analytics. A data catalog provides a managed and scalable data discovery and metadata management capabilities which are fundamental requirements of attaining higher levels of data democratization in an organization. The Data Mart A data mart is a subset of a data warehouse focused on a specific business vertical or data domain. Data marts enable specific users to access specific data that empowers them to quickly access these datasets without wasting time searching for the same in the data warehouse. For instance, individual departments like sales, marketing, operations, and finance can have their respective data marts for accelerating their domain-specific data-driven decision making. The Metrics Catalog A metrics catalog is a new layer in the modern data stack. It is a centralized store for all of your organizations’ most important metrics (or key performance indicators) and it's uniquely positioned between the data warehouse and downstream tools. As a self-service place for business KPIs, every stakeholder in the organization has access to track their own metrics and share context with others. By capturing core business metrics in this fashion and this location in the modern data stack, a metrics catalog provides immense visibility and transparency into an organization's most critical metrics and metric lineage for all stakeholders in an organization. This new concept of a metrics catalog can have a significant role to play in democratizing data to everyone. As a single source of ground truth for business data, a metrics catalog enables diverse stakeholders to base all key decisions on the same foundation. It also allows for disparate teams to use the same metrics, ask questions, and keep everyone aligned and on track. This greatly enhances the level of data democratization within an organization. Challenges for data democratization Although the benefits of data democratization are pretty evident, there are also numerous challenges. Some challenges are common, like data being kept in silos and unclear data ownership. The informational silos problem is antithetical to data democratization, and can adversely impact an organization's ability to leverage data for improvising its business performance and decision making. Different teams have ownership of different types of data, which contributes to the problem of information silos. When a particular team has exclusive access to specific data assets, they not only hinder other teams from accessing the data but also guard their analysis and insights derived from the same data. This often leads to duplication of efforts across teams, causing a massive waste of organizational time and resources. As each individual team or department hoards its own data and analyses, it contributes to the adoption of the same undemocratic processes across other teams further compounding the challenges in promoting data democratization. With greater access to the organizational data assets, there is also a challenge of data security, privacy, and potential misuse of the data. It increases the number of gaps in the organization which might become vulnerable to adversarial attacks and data breachers. This is why it’s important to have a balance between data security and data access—including having stronger safeguards around who can access and analyze personally-identifiable information and customer data. Looking ahead If implemented well, data democratization can provide an immense competitive edge that will only compound over time as organizations mature in their digital transformation journey. Several tools and data artifacts can aid in better implementation and adoption of best practices and policies that help in democratizing data. A metrics catalog is one relatively new tool that provides a centralized store of business critical information accessible to multiple stakeholders. It captures essential business metrics and provides a simplified interface that is agnostic of the separate analytics, CRM, and BI platforms used by various teams in the organization. Learn more about how a metrics store can promote data democratization and governance at Transform.co. Introduction
Kubernetes, or K8s for short, is a massively popular and developer-friendly cloud-based technology for deploying, scaling, and managing containerized applications, including software and, more recently, machine learning models. Kubernetes was originally created by Google for managing in-house application deployment, but now, Kubernetes is an open-source system maintained by the Cloud Native Computing Foundation (CNCF). Kubernetes is a one-stop cloud-native platform for automating operations associated with container-based applications, like Docker. Its popularity and adoption in the software engineering and AI industry cannot be emphasized enough, with leading cloud providers, like AWS (EKS), Azure (AKS), and Google Cloud Platform (GKE), providing their own Kubernetes-based platform offerings. It is important to consider the concept of containers that Kubernetes builds upon. Containers are a method of packaging apps, along with all their dependencies and configuration settings, so that the app can be seamlessly deployed across various runtime production environments. While alternatives, like virtual machines and Docker Swarm, abound, Kubernetes has emerged as the de facto platform of choice for container orchestration and management. Swarm is Docker’s native platform for orchestrating clusters of Docker engines. Virtual machines are related to containers in that containers are more flexible, lightweight, and portable, as there is no need to install an OS in every instance. The evolution of virtual machines to containers to orchestration platforms like Kubernetes has helped organizations better manage their application deployment and operational workloads. In this article, you will learn more about Kubernetes and its applications in the domain of software engineering and machine learning. Discover the many benefits that Kubernetes offers and why start-ups and enterprises should consider migrating their deployment systems to Kubernetes. You will explore a comprehensive overview of the key factors to consider and evaluate from an organizational perspective before making the decision of whether and when to migrate to Kubernetes from other architectures. Common Problems that Kubernetes Solves Kubernetes is the market-leading solution for the orchestration of container-based applications. According to the 2020 CNCF survey, 83% of respondents were using Kubernetes in production. Kubernetes solves a multitude of problems by helping run containers at scale. Containers on their own are not self-sufficient and, thus, cannot be executed efficiently. This leads to problems, like increased app delivery times and operational burdens, causing delays to product launches and poor customer experience. Slower application development, deployment, and delivery cycles can result in a significant loss of revenue and customer trust. Migration to Kubernetes can help solve application deployment inefficiencies by offering the following advantages:
Cost Efficiency Having a single, centralized platform to manage all application deployments leads to reduced costs associated with hosting and migration, as well as tech support. Furthermore, autoscaling and the selection of the right type of node also helps to optimize costs. Consistency Kubernetes provides better consistency via a holistic runtime production environment for developers, quality assurance, and administrative staff. Portability As Kubernetes is portable across cloud as well as on-premises servers, any organization that has its infrastructure and databases hosted on the cloud, on-premises, or through a hybrid approach can use and scale Kubernetes for their applications. Scalability Kubernetes provides for horizontal scalability as well as elasticity and automation with little to no performance issues or downtimes. Its autoscaling feature allows for the total containers to be scaled based on the application requirements. The number of resources can be scaled up or down per the requirement and demand of the service response. Security Kubernetes has a number of security features, including controlling access to the Kubernetes API, controlling the capabilities of a workload or user at runtime, and protecting cluster components from being compromised. Reasons to Avoid Kubernetes Despite its many benefits and advantages, Kubernetes may not be the right choice for your organization just yet. While migration to Kubernetes might eventually pay off in terms of your investment on time, budget, and organizational efforts, there are still many reasons to avoid Kubernetes in the near term. So migrate only when the organizational processes, systems, staff, and culture are mature enough to adopt Kubernetes. If the current system is not broken, does it make sense to overhaul it and potentially create new problems that may impact critical business goals? While Kubernetes is a smart long-term solution, there are many challenges to overcome before, during, and after the migration. In general, it is advisable for a Kubernetes-ready organization to have already moved to the cloud and have considerable experience managing, developing, and deploying via cloud-based services and containerization as well. The turning point comes when the organization is beginning to face difficulties in terms of scaling and stability, and the operational overhead is eating up too much organizational bandwidth, thereby adversely impacting engineering excellence. Steep Learning Curve It is important to understand that while Kubernetes may be easier to onboard and start, it is difficult to execute well and involves a steep learning curve. Many organizations jump on the Kubernetes bandwagon too soon, based on a single successful proof of concept. Such pilot experiments, while valuable in terms of the experience, should be treated with caution. Most pilot experiments are not run under production loads, stress tested for scale, integrated with CI/CD pipelines, or based on a stable Kubernetes configuration. Cost In terms of cost, it is important to bear in mind that Kubernetes will not save costs out of the gate, and it will take some time for the systems to mature before the cost-efficiency of Kubernetes becomes clear. For any organization to make such a critical business decision, the technical and engineering leadership must understand this key economic aspect and show full commitment and patience until the return on investment is evident. Furthermore, the migration can take up a lot more time than anticipated. It takes time to learn, configure, and optimize Kubernetes settings for various applications across the enterprise. There are no standard timelines for attaining organizational maturity, as it markedly varies from one organization to another. Required Knowledge If your organization does not have engineers who have a deep understanding of Kubernetes’s basics and containers, especially aspects like networking, Docker, pods, and nodes, then migration will be an uphill challenge. Management of Kubernetes takes specialized knowledge, and the limited availability of such talent is a major bottleneck when considering migration to Kubernetes. Even if there are experienced developers in an organization, they need to keep abreast of the latest developments from Kubernetes’s open-source community and make periodic updates to avoid disruption. Additionally, there is a whole suite of additional tools (for example, kubectl CLI), services, CI/CD workflows, and DevOps and MLOps practices that need to be mastered for confidently managing the entire ecosystem of Kubernetes-based tasks and operations. Considerations for Migrating from Various Architectures As shown in the figure below, migrating to Kubernetes is an evolutionary journey that is specific to the existing architectures; for example, monoliths, Docker Swarm, or virtual machines. In the case of a monolith to Kubernetes migration, the change in complexity is immense. Monolith applications are easier to debug and test, and their simplicity makes deployment that much easier. They also facilitate faster end-to-end testing. During this type of migration, it is important to note that not all existing workloads are ready to move to containers. Knowing what workloads to move and what kind of applications can or cannot be containerized are crucial considerations. Migration from Docker Swarm tends to be relatively easier compared to a transition from monolith applications since container-based applications already exist. While Swarm is simpler and easier to operate, Kubernetes is a more complicated platform with a steep learning curve. For this migration, factors like the nature of current infrastructure, configuration and scale, governance, identity and access controls, networking and storage management, and customer-specific integrations and applications must be taken into consideration. Migrating directly from virtual machines to Kubernetes might appear like a tough challenge. However, this transition has been made easier through the open-source project KubeVirt, which enables virtual machine workloads to be run as pods inside a Kubernetes cluster. It provides a unified platform for deploying applications based on booth containers and virtual machines in a common, shared environment. Final Thoughts Kubernetes has emerged as the de facto choice for the orchestration of container-based applications. Its popularity and success are due to its many advantages that enable secure, portable, scalable, cost-efficient, and consistent deployment from cloud, on-premises, or hybrid environments. However, the decision to migrate to Kubernetes is not always straightforward. It involves the evaluation of several factors, including the prior experience with cloud or containers, availability of expert staff, overcoming of the steep learning curve, cost and duration of the migration, and organizational support for patiently investing in a platform with benefits that may only become apparent in the longer term. In this article, you also learned the top considerations for migrating from other architectures, like monoliths, virtual machines, and Docker Swarm. While the decision to move to Kubernetes may eventually be a no-brainer, timing the migration requires a critical understanding of the complex ecosystem of Kubernetes architecture and business-specific analysis of whether your organization is ready to move. Introduction
Data governance is a fundamental pillar of modern digital businesses. It refers to a framework of processes and guidelines that companies use to ensure all enterprise data assets are managed and utilized appropriately. Even if an organization has large investments in data infrastructure and teams, without a structured data governance framework, organizations will struggle to harness the full value of their data. A strong framework provides a clear set of guidelines for all employees who access and consume data in downstream applications. It also contributes to greater trust in the authenticity and quality of data and allows data stakeholders to focus on core data tasks instead of worrying about whether the data was created, processed, stored accurately, and in compliance with national or domain-related legislations like GDPR, HIPAA, CCPA, and data localization laws. Given recent data breaches, the importance of a structured data governance framework cannot be emphasized enough. In this article, you’ll learn how to ensure data quality through better data governance mechanisms, leading to an increase in data informed decision-making. You’ll also learn how a clear data governance framework contributes to improved data quality and value creation across the entire organization. Why do you need data governance? The digital revolution is founded on data and the idea that data can generate insights that are critical for decision-making and long-term planning. With the emergence of cloud technologies, it’s easier for businesses to see the importance of data and store it in a more accessible, scalable, and secure way. A data governance framework is a set of rules and processes for collecting, storing, and using data. This diagram shows a simplified outline for how to think about building a data governance framework for your organization.However, collecting and storing data is just the tip of the iceberg. Without a clear and robust governance framework, you can’t fully understand the value of your data. High-quality data will help you make the best possible decision for your company. A data governance framework consists of several layers, stakeholders, business goals, and structured processes with a focus on information and project management. This accountability means organizations can build high-quality data products with confidence. This is evident in the case of top technology companies like Google and Amazon that have invested early and massively in data and data-driven technologies. They benefited from investing and enforcing a data governance framework that lowers the organizational threshold, velocity, and efficiency with which businesses can adapt to change. So, why is data governance important? Investing in data governance leads to many benefits including:
Ensure data quality through governance A major outcome of a solid data governance framework, if carried out properly, is improved data quality. When organizations follow these guidelines, it leads to a clearer understanding of their data assets and increases accountability. First, think about your data lineage. Record the source of each data set and the date/time that it is accessed. It’s also critical to understand the teams that are accessing the data including the applications they’re using.This ensures compliance and prevents data breaches. You can test data quality by asking different stakeholder teams to provide the value for a common business metric. More often than not, different teams will have conflicting answers for the same metric. This can be the result of a flaw in your data governance strategy, fuzzy guidelines, or scattered metrics logic across downstream tools. Create policies that ensure data accuracy Maintaining accurate data across the organization is difficult but rewarding. Once a new data asset is created, either internal or external, it needs to be systematically logged and entered into the appropriate databases. Consistently using data governance best practices for completeness, relevance, reliability, and lifecycle can lead to better data quality and accuracy. Develop practices to test data completeness Data completeness refers to the wholeness of the data. Data is complete when there are no missing values, records, or duplicates. Basic automated checks to validate the number of rows and columns, dimensionality, missing and null values, and data format mismatch can help identify missing elements. Adopt technologies to check data relevance Data relevance refers to the utility of data in providing critical insights. It’s important to remember that not all data is useful or relevant to particular business problems, and identifying the right set of input data can help focus subsequent analytics and modeling efforts. Track relevance with data reliability Data reliability is an indicator of how useful and relevant it is over time. It builds upon the concepts of completeness and relevance, and is more likely to be used and reused by teams for their work. This lays the foundation for multiple use cases and business insights. Stay compliant with data depreciation and lifecycleData timeliness and lifecycle management provides clear timelines for the validity and deprecation of data, ensuring that it’s used only when relevant and compliant with privacy laws. This regulates the lifecycle before it is depreciated or deleted permanently. Standardizing metrics as part of your data governance strategy Let’s take a look at how you can standardize your metrics through metrics catalogs and policies and build into a data governance strategy that ensures data quality. Catalog metrics in a metrics storeStandard metrics like annual recurring revenue (ARR), gross merchandise value (GMV), customer acquisition cost (CAC), customer lifetime value (LTV), and net promoter score (NPS) are common. Once you've defined your metrics, these metrics can be stored in a metrics catalog for greater ease of access, use, and re-use across the organization. A metrics catalog has several advantages. It reduces valuable organizational time and effort to reproduce the underlying analysis, and it creates a centralized metrics store that facilitates better understanding and decision-making. As depicted in the figure below, a metrics store is a centralized and governed place for organizations to store key metrics, creating a repository for stakeholders to access key metrics in a repeatable way, regardless of where people access their data. Policies and practices for sign-off Before creating a metric, there needs to be a clear policy on the steps that people use to analyze and validate their business metrics. Data quality policies should not be treated as an administrative exercise but regarded as an important milestone in this stage of data transformation. In addition to assigning an owner for each of your critical metrics, you should also think about executive sponsorship for the organization’s most important, “north-star” metrics. A stamp of approval from the C-suite or an executive sponsor conveys the importance of the data policy framework to the entire organization but can also be used to negotiate and expedite resolutions when conflicts arise. Conclusion In this article, you’ve learned about data quality as an index that can be used for many attributes of data in an organization. A data governance framework creates a set of best practices that improve data accuracy and relevance. A data governance framework also makes it possible to distribute high-quality data to your teams in the most efficient way possible. Building a metrics store is a critical part of this process because metrics are the language that you use to express whether you achieved your organizational goals. A metrics store, like the Transform Metrics Store, centralizes all of this knowledge in one place for easy access and collaboration. To learn more about the metrics catalog and other solutions, visit Transform.co. Introduction
Data drift is a common problem for production machine learning systems. It occurs when the statistical characteristics of the training (source) and test (target) data begin to differ significantly. As illustrated in the image below, the orange curve depicting the original data distribution shifts to the purple curve, representing a change in statistical properties like the mean and variance. Understanding data drift is fundamental to maintaining the predictive power of your production machine learning systems. For instance, a data science team may have started working on a machine learning use case in 2019, using training data from 2018, but by the time the model is ready to go into production, it’s 2020. There could be a huge change in the distribution between the source data from 2018 and the live data coming from 2020. Any time a machine learning model is ready to be shipped, it needs to be rigorously tested on live data. It’s critical that you detect data drift before deploying a model to production. In this article, I’ll illustrate the various types of data drift and how data drift impacts model performance along with several examples. I’ll also address data labeling, one of the popular ways to tackle data drift, and how to perform data labeling efficiently. Why Data Drift Happens? In real-world situations, data drift can occur due to a variety of reasons:
Continuing with the COVID-19 example, a model trained on data prior to the onset of global lockdowns, say from January to February 2020 will yield poor predictions on data in March and April 2020 after the lockdowns started. Thus, the original trained model is no longer relevant or practically useful and needs to be retrained. Even small changes in the data structure or format of the source data can have significant consequences for machine learning models. For instance, a change in the format of a data field, like an IP address or hostname or ID, can often go undetected for a long time without effective root cause analysis. Types of Data Drift There are different types of data drift, but the two principal ones are: Covariate drift refers to data drift associated with a shift in the independent variables. It happens when a few features change while still maintaining the same relationship between the feature and the target variable. Covariate drift primarily occurs due to sample selection bias, which is a systematic bias in the selection of training data that results in a nonuniform and nonrepresentative training dataset. Nonstationary environments, where the training environment differs from the test environment, also cause covariate drift. Concept drift, on the other hand, occurs when the relationship between the independent variables and the target variable changes. Consider a product recommendation machine learning model in the context of e-commerce, where the original model is trained on user activity and transactions from users located in the US. Now imagine that the e-commerce company is going to launch in a new locale or market with the same product catalog as in the US. The original recommendation model will perform poorly when applied to users from the new market with significantly different online shopping behavior, financial literacy, or internet access for e-commerce. In this example, the online shopping behavior of the users is markedly distinct. Even if the same features are used to train the machine learning model, it might underperform significantly. In such cases, concept drift is the root cause of data drift, and the personalization model needs to be reworked and include new features that better capture the new user behavior. Overcoming Drift with Data Labeling To overcome data drift, you need to retrain the model using all available data, including data from before and after drift occurred. New data needs to be labeled accurately before including it in the new training dataset. Data labeling refers to the process of providing meaningful labels to target variables in the context of supervised machine learning where the target could be an image or text or an audio snippet. In the context of data drift, data labeling is crucial to countering data drift, and thereby directly affects the performance of machine learning models in production. Data labeling is integral to supervised machine learning where a model is fed input data along with relevant labels depending on the use case. For example, for a model learning to detect product placement in videos, the model is fed a video with products highlighted in the video. Typically, data labeling is a manual exercise that’s both costly and time-consuming. It’s often outsourced to vendors in developing countries associated with low cost of labor. Annotators need to be trained to use labeling software, understand the machine learning use case and the annotation framework, and deliver highly accurate labels at a high velocity and throughput. In such a scenario, labeling errors can occur, which exacerbates the problem of data drift if data from the new test or target distribution isn’t labeled accurately. In practice, several controversial labeling errors have occurred that cause reputational damage to the company, for instance, when Google Photos labeled two Black people as “gorillas.” Big technology companies like Google and Facebook are grappling with such issues in their automated data labeling algorithms. Labeling errors can be made by human annotators, and also by machine learning models. Once trained, the predictions made by machine learning models on new data are often reused to augment the original training data to further improve the models. In such scenarios, data labeling errors can compound resulting in imperfect models that often yield such bizarre and controversial results. Data labeling helps alleviate data drift by incorporating data from the changed distribution into the original training dataset. If enough new data is labeled, then it is possible to drastically reduce data drift by simply dropping the older data and only using the newly labeled data. Therefore, proper and efficient data labeling is a crucial exercise with significant commercial impact, depending on the nature of the machine learning application. For example, incorrect data labels in a fraud detection use case can result in monetary loss every time the fraud detection machine learning model makes an incorrect prediction. Inaccurate data labels not only impact the performance of the machine learning model but also indirectly contribute to data drift. Any systematic data labeling errors may compound the problem as the model’s predictions on new data are typically leveraged to augment the training dataset. Data labeling can be improvised and performed effectively through the use of intuitive software that enables human annotators to label data with high speed and low cognitive load. For additional improvement in data labeling, you can implement inter-annotator agreement; a particular training example is assigned a label that’s selected by a majority of the annotators. For example, if four out of seven annotators assign “Label1” to a particular data sample and the other three annotators assign it “Label2,” then the data sample would be tagged with “Label1.” Strong operational practices including auditing of randomly selected labels for accuracy can improve the process and provide feedback about systematic labeling errors. You can also use machine learning to aid data labeling with a model trained on a sample of data that’s labeled by humans to generate predictions on new or unlabeled data. These noisy labels can then be leveraged to build better machine learning models by incorporating the data samples associated with high probability and sending the data samples with low probability back to human annotators for more accurate labels. This process can be repeated iteratively to improve the overall performance of the model with minimal human data labeling efforts. Conclusion Data drift can have a negative impact on the performance of machine learning models as data distribution changes. This can cause a machine learning model’s predictive accuracy to go down over time if not countered effectively. Data labeling is one technique to reduce data drift by applying labels to data from the new or changed distribution that the model does not predict well. This helps the machine learning model to incorporate this new knowledge during the training process to improve its performance. There are several tools available today that enable annotators to label data efficiently. For example, Label Studio is an open-source data labeling tool that provides a platform for labeling different data types, including images, text, audio as well as multi-domain data. It’s already used by leading technology companies including Facebook, NVIDIA, Intel, so check it out if you’re looking for a robust, open-source solution for reducing data drift. Published by Neptune.ai Introduction
In 2010, DJ Patil and Thomas Davenport famously proclaimed Data Scientist (DS) to be the “Sexiest Job of the 21st century”. The progress in data science and machine learning over the last decade has been monumental. Data science has successfully empowered global businesses and organizations with predictive intelligence and data-driven decision-making to the extent that data science is no longer considered a fringe topic. Data science is now a mainstream profession and data science professionals are in high demand a cross all kinds of organizations from big tech companies to more traditional businesses. A decade earlier the focus of data science was more on algorithmic development and modeling to extract robust insights from data. However, as data science has evolved over the decade, it has become clearer that data science involves more than just modeling. The machine learning lifecycle, from raw data through to deployment, now relies on specialized experts including data engineers, data scientists, machine learning engineers along with product and business managers. The role of a machine learning engineer is gaining prominence across companies as they realized that the value of data science cannot be realized until a model is successfully deployed to production. Whilst a lot of tools and technologies such as Cloud APIs, AutoML, and a number of Python-based libraries have made the job of a data scientist easier, the MLOps of putting models into production and monitoring their performance is still quite unstructured. For a detailed look at the respective skills, responsibilities, and tech stack of various profiles, ranging from a data scientist to a data science manager, refer to my previous article on how to build effective machine learning teams in the industry [2]. There are four core steps in executing a data science project:
Thus, the definition and scope of a data scientist vs. a machine learning engineer is very contextual and depends upon how mature the data science team is. For the remainder of the article, I will expand on the roles of a data scientist and a machine learning engineer as applicable in the context of a large and established data science team. In this article, I will:
Differences between Data Scientist & Machine Learning Engineer In this section, I will discuss the primary differences in skills, responsibilities, day-to-day tasks, tech stack amongst other things. The chief responsibility of a data scientist is to develop solutions using machine learning or deep learning models for various business problems. It is not always necessary to create novel algorithms or models as these tasks are research-intensive and can take up considerable time. In most cases, it is sufficient to use existing algorithms or pre-trained models, and optimize them in the context of the problem statement. However, in more innovative and R&D-focused teams or companies, scientists may be required to produce novel research and model artifacts. On the contrary, the main goal of machine learning engineers is to take the models prepared by the data scientists and take them to production. This involves multiple aspects including model optimization to make it compatible with the custom deployment constraints and building MLOps infrastructure for experimentation, A/B testing, model management, containerization, deployment, and monitoring the model performance once deployed. These factors translate into the underlying differences in skills, responsibilities, and tech stack for the respective roles as shown in the following tables. Similarities, interference & handover Similarities between Data Scientist and ML Engineer As evident from Tables 1-3, there is a partial overlap between the skills and responsibilities of data scientists and machine learning engineers. The tech stack is also quite similar and whilst data scientists are expected to mostly code in Python, machine learning engineers also need to know C++ for porting the model artifacts into a more efficient and faster format. What machine learning engineers might lack in terms of subject matter expertise compared to data scientists, they make up for it in terms of knowledge of engineering tools and frameworks like Kubernetes that data scientists are less familiar with. Data scientists usually have a STEM background or even advanced degrees like a Ph.D. in diverse fields like biology, economics, physics, mathematics amongst others. On the other hand, machine learning engineers generally have professional experience as software engineers. While data scientists primarily deal with algorithmic and model development, machine learning engineers’ key focus is on scalable software engineering relevant to model deployment and monitoring, the remaining tasks are often common to both profiles. In a few cases, these tasks might be shared depending on the size and maturity of the data science team, and things might work smoothly. However, more often than not, especially in larger teams and organizations, this can create considerable conflict and friction especially when data scientists and machine learning engineers work in different teams and report to different managers. The handover processIt is possible to draw a clear line between the respective mandates of data scientists and machine learning engineers. Typically, data scientists will develop one or more candidate machine learning models and hand over these to the machine learning engineers following a specific contract. The contract should specify:
A structured handover contract ensures that the machine learning engineers have all necessary information to work on model optimization, any further experimentation, and deployment processes. After the handover, the data scientists become free to focus on the next machine learning use cases to take to production. The collaboration between data scientists and machine learning engineers continues post-deployment and becomes critical especially when the models break in production. As the data scientists have greater insight into the working of the model, they are better positioned to troubleshoot and fix the models. At the same time, some model failures are related to cracks in the underlying infrastructure developed by machine learning engineers, which they are in the best position to resolve. Continuous refinement of the model based on live data received by the model via active learning also falls under the domain of data scientists. Communication & Collaboration between Data Scientists & ML Engineers The success of a data science team is contingent on strong collaboration across the varied profiles [2]. Data scientists and machine learning engineers collaborate continuously during model development, deployment, and post-deployment monitoring and refinement. Ideally, if these two profiles ought to be part of the same team and report to the same leadership. In such a context, collaboration becomes easier and also fosters strong collegiality and learning from each other. However, when data scientists and machine learning engineers are part of different teams and report to different leadership, the collaboration is not as strong as it should be. In such organizational settings, data scientists and machine learning engineers do not get to interact directly as much and rely on team productivity and project management tools like Slack, Teams, JIRA, Asana, etc. For a lot of repetitive and common use cases, the use of such collaboration tools is actually a boon and saves the team a lot of time and effort. However, the transactional nature of relying on tools whose atomic units are tickets or tasks does not create a sense of team bonding and collaboration. In data science teams that rely heavily on such tools, this is a common grievance. For more complex tasks or projects, in-person or video collaboration is a must and should not be ignored by the leadership. It is often in these settings that the technical professionals might learn of new use cases or clients from the business leaders, and the business professionals in turn might learn of a new technical breakthrough that could solve up-and-coming business use cases. The same holds true for data scientists and machine learning engineers as well, where each party could learn of either a new algorithm, or a model, or a new framework to make data science more effective and productive. Current industry trends If a new version of the Harvard Business Review article in [1] were to be published in 2021, it would claim “machine learning engineer” as the sexiest job of the 2020s. While data science and model development is still a lucrative role across industry and academia, in recent years the focus in the industry has slightly shifted to building scalable and reliable infrastructure to serve data science models to millions of customers. As of today, the machine learning engineer role is in much greater demand than that of a data scientist across the tech industry.
The transition from Data Scientist to Machine Learning Engineer There are numerous online courses on learning platforms like Coursera, Udacity, Udemy, etc. but there is a relative paucity of instructors and content focused on machine learning engineering practices. While building data science models can occur in a sandbox environment like Kaggle where the models are not made to serve real-world predictions, it is only possible to learn scalable model deployment, monitoring, and related machine learning engineering tasks in a real-world industry setting. As machine learning engineering and MLOps is a more applied discipline, there are fewer experts who have the required skillset to build and maintain robust infrastructure. At the same time, existing data scientists, lured by the promise of greater potential impact, better compensation, and long-term career prospects are also seeking to transition into MLE roles. As illustrated in tables 1, 2, and 3, there is considerable overlap between the two roles. However, machine learning engineers focus on the “engineering” aspects of taking models to production while data scientists focus on developing the right set of models for specific business problems. The most relevant skills that data scientists need to learn to become an effective machine learning engineer is software engineering including the ability to write optimized code, preferably in C++, rigorous testing, and understand and build and operate existing or custom tools and platforms for reliable model deployment and management. It is definitely possible for data scientists to learn C++ and best practices in software engineering and software testing, as well as onboard new tools and technologies like Docker, Kubernetes, ONNX, and model serving platforms from multiple sources. However, since companies require machine learning engineers to have prior relevant experience, it becomes practically infeasible for data scientists to justify a machine learning profile if they do not have real-world hands-on experience in industry settings. Given the chicken-and-egg nature of this problem, the best avenue for existing data scientists to transition to machine learning engineering is with their current employer. If data scientists express interest in machine learning engineering to their managers and are allowed to shadow or even assist and collaborate with machine learning engineers on specific projects, it becomes easier to make an internal transition within the same company. This represents a challenge for fresh graduates without any prior industry experience, and a similar internal transition route from data science or software engineering to machine learning engineering is the recommended pathway. As the industry matures and companies evolve their machine learning systems and associated processes like hiring and upskilling, it will become easier for more candidates to make the transition from data science to machine learning engineering. For more complex tasks or projects, in-person or video collaboration is a must and should not be ignored by the leadership. It is often in these settings that the technical professionals might learn of new use cases or clients from the business leaders, and the business professionals in turn might learn of a new technical breakthrough that could solve up-and-coming business use cases. The same holds true for data scientists and machine learning engineers as well, where each party could learn of either a new algorithm, or a model, or a new framework to make data science more effective and productive. Conclusion AI is a cornerstone of modern enterprise. This AI-revolution has accelerated significantly over the last decade and resulted in huge unmet demand for data science professionals. Data science as a discipline has also evolved, creating distinct profiles focused on data, modeling, engineering as well as product and customer success management. Of these profiles, machine learning engineers play a critical role in taking the models developed by data scientists based on the data prepared by data engineers and for use cases identified and developed by product or business managers to fruition. Currently, the demand for machine learning engineers is similar to the demand for data scientists a decade ago. Such changes in the scope and nature of profiles in the AI industry will continue to happen, and present new challenging opportunities to engineers, scientists as well as business professionals to get their foot in the door. References [1] https://hbr.org/2012/10/data-scientist-the-sexiest-job-of-the-21st-century [2] https://neptune.ai/blog/how-to-build-machine-learning-teams-that-deliver [3] https://neptune.ai/blog/building-ai-ml-projects-for-business-best-practices Published by Neptune.ai Introduction
Large-scale machine learning and deep learning models are increasingly common. For instance, GPT-3 is trained on 570 GB of text and consists of 175 billion parameters. However, whilst training large models helps improve state-of-the-art performance, deploying such cumbersome models especially on edge devices is not straightforward. Additionally, the majority of data science modeling work focuses on training a single large model or an ensemble of different models to perform well on a hold-out validation set which is often not representative of the real-world data. This discord between training and test objectives leads to the development of machine learning models that yield good accuracy on curated validation datasets but often fail to meet performance, latency, and throughput benchmarks at the time of inference on real-world test data. Knowledge distillation helps overcome these challenges by capturing and “distilling” the knowledge in a complex machine learning model or an ensemble of models into a smaller single model that is much easier to deploy without significant loss in performance. In this blog, I will:
What is knowledge distillation? Knowledge distillation refers to the process of transferring the knowledge from a large unwieldy model or set of models to a single smaller model that can be practically deployed under real-world constraints. Essentially, it is a form of model compression that was first successfully demonstrated by Bucilua and collaborators in 2006 [2]. Knowledge distillation is performed more commonly on neural network models associated with complex architectures including several layers and model parameters. Therefore, with the advent of deep learning in the last decade, and its success in diverse fields including speech recognition, image recognition, and natural language processing, knowledge distillation techniques have gained prominence for practical real-world applications [3]. The challenge of deploying large deep neural network models is especially pertinent for edge devices with limited memory and computational capacity. To tackle this challenge, a model compression method was first proposed [2] to transfer the knowledge from a large model into training a smaller model without any significant loss in performance. This process of learning a small model from a larger model was formalized as a “Knowledge Distillation” framework by Hinton and colleagues [1]. As shown in Figure 1, in knowledge distillation, a small “student” model learns to mimic a large “teacher” model and leverage the knowledge of the teacher to obtain similar or higher accuracy. In the next section, I will delve deeper into the knowledge distillation framework and its underlying architecture and mechanisms. Diving deeper into knowledge distillation A knowledge distillation system consists of three principal components: the knowledge, the distillation algorithm, and the teacher-student architecture [3]. Knowledge In a neural network, knowledge typically refers to the learned weights and biases. At the same time, there is a rich diversity in the sources of knowledge in a large deep neural network. Typical knowledge distillation uses the logits as the source of teacher knowledge, whilst others focus on the weights or activations of intermediate layers. Other kinds of relevant knowledge include the relationship between different types of activations and neurons or the parameters of the teacher model themselves. The different forms of knowledge are categorized into three different types: Response-based knowledge, Feature-based knowledge, and Relation-based knowledge. Figure 2 illustrates these three different types of knowledge from the teacher model. I will discuss each of these different knowledge sources in detail in the following section. 1. Response-based knowledge As shown in Figure 2, response-based knowledge focuses on the final output layer of the teacher model. The hypothesis is that the student model will learn to mimic the predictions of the teacher model. As illustrated in Figure 3, This can be achieved by using a loss function, termed the distillation loss, that captures the difference between the logits of the student and the teacher model respectively. As this loss is minimized over training, the student model will become better at making the same predictions as the teacher. In the context of computer vision tasks like image classification, the soft targets comprise the response-based knowledge. Soft targets represent the probability distribution over the output classes and typically estimated using a softmax function. Each soft target’s contribution to the knowledge is modulated using a parameter called temperature. Response-based knowledge distillation based on soft targets is usually used in the context of supervised learning. 2. Feature-based knowledge A trained teacher model also captures knowledge of the data in its intermediate layers, which is especially pertinent for deep neural networks. The intermediate layers learn to discriminate specific features and this knowledge can be used to train a student model. As shown in Figure 4, the goal is to train the student model to learn the same feature activations as the teacher model. The distillation loss function achieves this by minimizing the difference between the feature activations of the teacher and the student models. 3. Relation-based knowledge In addition to knowledge represented in the output layers and the intermediate layers of a neural network, knowledge that captures the relationship between feature maps can also be used to train a student model. This form of knowledge, termed as relation-based knowledge is depicted in Figure 5. This relationship can be modeled as correlation between feature maps, graphs, similarity matrix, feature embeddings, or probabilistic distributions based on feature representations. Training There are three principal types of methods for training student and teacher models, namely offline, online and self distillation. The categorization of the distillation training methods depends on whether the teacher model is modified at the same time as the student model or not, as shown in Figure 6. 1. Offline distillation Offline distillation is the most common method, where a pre-trained teacher model is used to guide the student model. In this scheme, the teacher model is first pre-trained on a training dataset, and then knowledge from the teacher model is distilled to train the student model. Given the recent advances in deep learning, a wide variety of pre-trained neural network models are openly available that can serve as the teacher depending on the use case. Offline distillation is an established technique in deep learning and easier to implement. 2. Online distillation In offline distillation, the pre-trained teacher model is usually a large capacity deep neural network. For several use cases, a pre-trained model may not be available for offline distillation. To address this limitation, online distillation can be used where both the teacher and student models are updated simultaneously in a single end-to-end training process. Online distillation can be operationalized using parallel computing thus making it a highly efficient method. 3. Self-distillation As shown in Figure 6, in self-distillation, the same model is used for the teacher and the student models. For instance, knowledge from deeper layers of a deep neural network can be used to train the shallow layers. It can be considered a special case of online distillation, and instantiated in several ways. Knowledge from earlier epochs of the teacher model can be transferred to its later epochs to train the student model. Architecture The design of the student-teacher network architecture is critical for efficient knowledge acquisition and distillation. Typically, there is a model capacity gap between the more complex teacher model and the simpler student model. This structural gap can be reduced through optimizing knowledge transfer via efficient student-teacher architectures. Transferring knowledge from deep neural networks is not straightforward due to their depth as well as breadth. The most common architectures for knowledge transfer include a student model that is:
Algorithms for knowledge distillation In this section, I will focus on the algorithms for training student models to acquire knowledge from teacher models. 1. Adversarial distillation Adversarial learning as conceptualized recently in the context of generative adversarial networks, is used to train a generator model that learns to generate synthetic data samples as close as possible to the true data distribution and a discriminator model that learns to discriminate between the authentic and synthetic data samples. This concept has been applied to knowledge distillation to enable the student and teacher models to learn a better representation of the true data distribution. To meet the objective of learning the true data distribution, adversarial learning can be used to train a generator model to obtain synthetic training data to use as such or to augment the original training dataset. A second adversarial learning based distillation method focuses on a discriminator model to differentiate the samples from the student and the teacher models based on either logits or feature maps. This method helps the student mimic the teacher well. The third adversarial learning-based distillation technique focuses on online distillation where the student and the teacher models are jointly optimized. 2. Multi-Teacher distillation In multi-teacher distillation, a student model acquires knowledge from several different teacher models as shown in Figure 7. Using an ensemble of teacher models can provide the student model with distinct kinds of knowledge that can be more beneficial than knowledge acquired from a single teacher model. The knowledge from multiple teachers can be combined as the average response across all models. The type of knowledge that is typically transferred from teachers is based on logits and feature representations. Multiple teachers can transfer different kinds of knowledge as discussed in section 2.1. 3. Cross-modal distillation Figure 8 shows the cross-modal distillation training scheme. Here, the teacher is trained in one modality and its knowledge is distilled into the student that requires knowledge from a different modality. This situation arises when data or labels are not available for specific modalities either during training or testing thus necessitating the need to transfer knowledge across modalities. Cross-modal distillation is used most commonly in the visual domain. For example, the knowledge from a teacher trained on labeled image data can be used for distillation for a student model with an unlabeled input domain like optical flow or text or audio. In this case, features learned from the images from the teacher model are used for supervised training of the student model. Cross-modal distillation is useful for applications like visual question answering, image captioning amongst others. 4. Others Apart from the distillation algorithms discussed above, there are several other algorithms that have been applied for knowledge distillation.
Applications of knowledge distillation Knowledge distillation has been successfully applied to several machine learning and deep learning use cases like image recognition, NLP, and speech recognition. In this section, I will highlight existing applications and the future potential of knowledge distillation techniques. 1. Vision The applications of knowledge distillation in the field of computer vision are plenty. State-of-the-art computer vision models are increasingly based on deep neural networks that can benefit from model compression for deployment. Knowledge distillation has been successfully employed for use cases like:
Knowledge distillation can also be used for niche use cases like cross-resolution face recognition where an architecture based on a high-resolution face teacher model and a low-resolution face student model can improve model performance and latency. As knowledge distillation can take advantage of different kinds of knowledge including cross-modal data, multi-domain, multi-task and low-resolution data, a wide variety of distilled student models can be trained for specific visual recognition use cases. 2. NLP The application of knowledge distillation for NLP applications is especially important given the prevalence of large capacity deep neural networks like language models or translation models. State-of-the-art language models contain billions of parameters, for example, GPT-3 contains 175 billion parameters. This is several orders of magnitude greater than a previous state-of-the-art language model, BERT, which contains 110 million parameters in the base version. Knowledge distillation is therefore highly popular in NLP to obtain fast, lightweight models that are easier and computationally cheaper to train. Other than language modeling, knowledge distillation is also used for NLP use cases like:
Case study: DistilBERT DistilBERT is a smaller, faster, cheaper and lighter BERT model [4] developed by Hugging Face. Here, the authors pre-trained a smaller BERT model that can be fine-tuned on a variety of NLP tasks with reasonably strong accuracy. Knowledge distillation was applied during the pre-training phase to obtain a distilled version of BERT model that is smaller by 40% (66 million parameters vs. 110 million parameters) and faster by 60% (410s vs. 668s for inference on the GLUE sentiment analysis task) whilst retaining a model performance that is equivalent to 97% of the original BERT model accuracy. In DistilBERT, the student has the same architecture as BERT and was obtained using a novel triplet loss that combined losses related to language modeling, distillation and cosine-distance loss. 3. Speech State-of-the-art speech recognition models are also based on deep neural networks. Modern ASR models are trained end-to-end and based on architectures that include convolutional layers, sequence-to-sequence models with attention, and recently transformers as well. For real-time, on-device speech recognition, it becomes paramount to obtain smaller and faster models for effective performance. There are several use cases of knowledge distillation in speech:
Case study: Acoustic Modeling by Amazon Alexa Parthasarathi and Strom (2019) leveraged student-teacher training to generate soft targets for 1 million hours of unlabeled speech data where the training dataset consisted only of 7000 hours of labeled speech. The teacher model produced a probability distribution over all the output classes. The student model also produced a probability distribution over the output classes given the same feature vector and the objective function optimized the cross-entropy loss between these two distributions. Here, knowledge distillation helped simplify the generation of target labels on a large corpus of speech data. Conclusions Modern deep learning applications are based on cumbersome neural networks with large capacity, memory footprint, and slow inference latency. Deploying such models to production is an enormous challenge. Knowledge distillation is an elegant mechanism to train a smaller, lighter, faster, and cheaper student model that is derived from a large, complex teacher model. Following the conceptualization of knowledge distillation by Hinton and colleagues (2015), there has been a massive increase in the adoption of knowledge distillation schemes for obtaining efficient and lightweight models for production use cases. Knowledge distillation is a complex technique based on different types of knowledge, training schemes, architectures and algorithms. Knowledge distillation has already enjoyed tremendous success in diverse domains including computer vision, natural language processing, speech amongst others. References [1] Distilling the Knowledge in a Neural Network. Hinton G, Vinyals O, Dean J (2015) NIPS Deep Learning and Representation Learning Workshop. https://arxiv.org/abs/1503.02531 [2] Model Compression. Bucilua C, Caruana R, Niculescu-Mizil A (2006) https://dl.acm.org/doi/10.1145/1150402.1150464 [3] Knowledge distillation: a survey. You J, Yu B, Maybank SJ, Tao D (2021) https://arxiv.org/abs/2006.05525 [4] DistilBERT, a distilled version of BERT: smaller, faster, cheaper and lighter (2019) Sanh V, Debut L, Chammond J, Wolf T. https://arxiv.org/abs/1910.01108v4 [5] Lessons from building acoustic models with a million hours of speech (2019) Parthasarathi SHK, Strom N. https://arxiv.org/abs/1904.01624 Published by Neptune.ai Introduction
Machine learning and deep learning models are everywhere around us in modern organizations. The number of AI use cases has been increasing exponentially with the rapid development of new algorithms, cheaper compute, and greater availability of data. Every industry has appropriate machine learning and deep learning applications, from banking to healthcare to education to manufacturing, construction, and beyond. One of the biggest challenges in all of these ML and DL projects in different industries is model improvement. So, in this article, we’re going to explore ways to improve machine learning models built on structured data (time-series, categorical data, tabular data) and deep learning models built on unstructured data (text, images, audio, video, or multi-modal). The strategy for improving machine learning models At this point, implementing ML and DL applications in business is still in its early days, and there is no single structured process that can guarantee success. However, there are some best practices that can minimize the likelihood of a failed AI project [1, 2, 3]. One of the main keys to success is model accuracy and performance. Model performance is mainly a technical factor, and for a number of machine learning and deep learning use cases, deployment doesn’t make sense if the model isn’t accurate enough for the given business use case. In the context of improving existing machine learning and deep learning models, there’s no one-size-fits-all strategy that can be consistently applied. I will review a set of guidelines and best practices that can be evaluated to systematically identify potential sources of improvement in accuracy and model performance. Table 1, above, shows a set of high-level factors that should be considered before starting to debug and improve ML and DL models. It highlights the crucial set of factors that underlie the business and technical constraints within which the machine learning or deep learning model has to be improved. For example, a machine learning model for predicting credit rating of new retail banking customers should also be able to explain its decision in case the credit card application is rejected. Here, simply optimizing for the technical metric isn’t enough if the model doesn’t offer explainability and guidance for the customer to understand and improve their credit score. For clarity’s sake, in this article, I assume that your machine learning or deep learning model has already been trained on in-house data for a specific business use case, and the challenge is to improve the model performance on the same test set to meet the required acceptance criteria. We’re going to explore several methods to improve model performance, so you’ll surely find one or two relevant to your use case. Ultimately, practice and experience working on a wide variety of models leads to better intuition about the best approaches to improve model accuracy and prioritize these techniques over others. Preliminary analysis The first step in improving machine learning models is to carefully review the underlying hypotheses for the model in the context of the business use case, and evaluate the performance of the current models. (1) Review initial hypotheses about the dataset and the choice of algorithms In an ideal scenario, any machine learning modeling or algorithmic work is preceded by careful analysis of the problem at hand including a precise definition of the use case and the business and technical metrics to optimize [1]. It’s far too common to lose sight of the pre-defined data annotation guidelines, dataset creation strategies, metrics and success criteria once the exciting stage of building machine learning or deep learning models begins. However, keeping the larger picture in mind is beneficial to streamline and prioritize the iterative process of improving machine learning and deep learning models. (2) Is the model overfitting or underfitting? This can be visualized as in Figure 1, below, by plotting the model prediction error as a function of model complexity or number of epochs. The difference between the training and test error curves shows overfitting, i.e., high variance and low bias or underfitting, i.e., high bias and low variance, and provides a useful proxy to understand the current state of the machine learning model. If the model is overfitting, it can be improved by :
(3) What kind of errors is the model making? For a typical classification problem, this can be visualized using plots like the Confusion Matrix, which illustrates the proportion of Type 1 (false positive), and Type 2 (false negative) errors. Figure 2 shows a confusion matrix for a representative binary classification problem. In this example, we have 15 True Positives, 12 False Positives, 118 True Negatives, 47 False Negatives. So:
Figure 3 shows another representative confusion matrix for a multi-class classification problem, a common use case in industry applications. At first glance, it’s clear to see that the model is confusing classes 1-5 with class 0, and in certain cases, it’s predicting class 0 more often than the true class. This suggests that there’s a systematic error in the model, most likely to do with class 0. Armed with this insight, the first step to improve this model would be to check the labeled training examples for potential annotation errors or for the degree of similarity between the examples belonging to class 0 vs. classes 1-5. Potentially, this error analysis might show relevant evidence like the labels from a particular annotator being systematically mislabeled, accounting for the high confusion rate between the corresponding classes or categories. Model optimization After initial analysis and evaluation of model accuracy, visualization of key metrics to diagnose the errors, you should see if you can extract additional performance from the current model by retraining it with a different set of hyperparameters. The assumption underlying a trained machine learning or deep learning model is that the current set of model weights and biases correspond to a local minima during the convex optimization process. Gradient descent should ideally yield a global minima that corresponds to the most optimal set of model weights. However, gradient descent is a stochastic process that varies as a function of several parameters including how the weights are initialized, the learning rate schedule, the number of training epochs, any regularization method used to prevent overfitting, and a range of other hyperparameters specific to the training process and the model itself. Each machine learning and deep learning model is based on a unique algorithm and intrinsic parameters. The goal of machine learning is to learn the best set of weights to approximate complex nonlinear functions from data. It’s often the case that the first trained model is suboptimal and finding the optimal combination of hyperparameters can yield additional accuracy. Hyperparameter tuning involves training separate versions of the models, each trained on a different combination of hyperparameters. Typically, for smaller machine learning models, it’s a quick process and helps identify the model with the highest accuracy. For more complex models including deep neural networks, running several iterations of the same model on different combinations of hyperparameter values may not be feasible. In such cases, it’s prudent to limit the range and choice of individual hyperparameter values based on prior knowledge or existing literature to find the most optimal model. Three methods of hyperparameter tuning are most commonly used: (1) Grid Search Grid search is a common hyperparameter optimization method that involves finding an optimal set of hyperparameters by evaluating all their possible combinations. It’s most useful when the optimal range of relevant hyperparameters are known in advance, either based on empirical experiments, previous work, or published literature. For instance, if you have identified 6 key hyperparameters and 5 possible values for each hyperparameter within a specific range, then grid search will evaluate 5 * 6 = 30 different models for each unique combination of hyperparameters. This ensures that our prior knowledge about the hyperparameter range is captured into a finite set of model evaluations. The downside of this method is it’s computationally expensive and it only samples from well-defined spaces in the high-dimensional hyperparameter grid. Therefore, as shown in Figure 4, it’s more likely to miss the local minima associated with optimal hyperparameter values outside the pre-defined range. To alleviate these limitations of grid search, random search is recommended. (2) Random Search Random search essentially involves taking random samples of the hyperparameter values, and is better at identifying optimal hyperparameter values that one may not have a strong hypothesis about [4]. The random sampling process is more efficient and usually returns a set of optimal values based on fewer model iterations. Therefore, random search is the first choice for hyperparameter optimization in many cases. (3) Bayesian Search Bayesian search is a sophisticated hyperparameter optimization method based on the Bayes Theorem [5]. It works by building a probabilistic model of the objective function, called the surrogate function, that is then searched efficiently with an acquisition function before candidate samples are chosen for evaluation on the real objective function. Bayesian Optimization is often able to yield more optimal solutions than random search as shown in Figure 5, and is used in applied machine learning to tune the hyperparameters of a given well-performing model on a validation dataset. Models & algorithms (1) Establish a strong baseline model To improve your machine learning or deep learning model, it’s important to establish a strong baseline model. A good baseline model incorporates all the business and technical requirements, tests the data engineering and model deployment pipelines, and serves as a benchmark for subsequent model development. The choice of the baseline model is influenced by the particular application, the kind of dataset, and the business domain. For instance, for a forecasting application for time-series data from the financial domain, an XGBoost model is a strong baseline model. In fact, for several regression and classification based applications, Gradient Boosted Decision Trees are commonly used in production. Therefore, it makes sense to start with a model that is known to produce robust performance in production settings. For unstructured data like images, text, audio, video, deep learning models are commonly employed across applications like object classification, image segmentation, sentiment analysis, chatbots, speech recognition, emotion recognition amongst others. Given the rapid advancement in the state-of-the-art performance of deep learning models, it’s prudent to use a more sophisticated model compared to an older one. For instance, for object classification, deep convolutional network models like VGG-16 or ResNet-50 should be the baseline, instead of a single layer convolutional neural network. As an example, for a face recognition application for CCTV image data from the security domain, a ResNet-50 is a strong baseline contender. (2) Use pre-trained models and cloud APIs Instead of training a baseline model yourself, in certain cases, you can save valuable time and energy by evaluating pre-trained models. There are a variety of sources like Github, Kaggle, or APIs from cloud companies like AWS, Google Cloud, Microsoft Azure, specialized startups like Scale AI, Hugging Face, Primer.ai amongst others. The advantage of using pretrained models or APIs is ease of use, faster evaluation, and savings in time and resources. However, an important caveat is that such pretrained models are often not directly applicable for your use cases, less flexible, and tricky to customize. Using Transfer Learning, however, pretrained models can be applied to your use case by not retraining complex models afresh, and instead fine-tuning model weights on your specific dataset. For example, the intrinsic knowledge of an object classification model like ResNet-50 trained on several image categories from the ImageNet dataset can be leveraged to accelerate model development for your custom dataset and use case. APIs are available for numerous use cases like forecasting, fraud, search, optical character recognition for processing documents, personalization, chat and voice bots for customer service, and others [6]. (3) Try AutoML While pretrained models are readily available, you can also investigate state-of-the-art AutoML technology for creating custom machine learning and deep learning models. AutoML is a good solution for companies that have limited organizational knowledge and resources to deploy machine learning at scale to meet their business needs. AutoML solutions are provided by cloud services like Google Cloud Platform [7] as well as a number of niche companies and startups like H2O.ai. The promise of AutoML is yet to be seen at scale, but it represents an exciting opportunity to rapidly build and prototype a baseline machine learning or deep learning model for your use case and fast-track model development and deployment lifecycle. (4) Model improvements Algorithmic and model-based improvements require greater technical expertise, intuition and understanding of the business use case. Given the limited supply of data scientists who combine all the above skills, it’s not common for most businesses to invest significant resources and allocate the necessary time and bandwidth for innovative machine learning and deep learning research and development. As most business use cases and organizational data ecosystems are unique, a one-size-fits-all strategy is often not feasible nor advisable. This necessitates the requirement for original work to adapt existing or related applications to fit the businesses’ particular needs. Model improvements can come from distinct sources:
(5) Case Study: from BERT to RoBERTa In this section, I will describe a case study in large-scale model improvement for a state-of-the-art deep learning model for natural language processing. BERT, developed in 2018 by Google [8], has become the de-facto deep learning model to use for a range of NLP applications and has accelerated NLP research and use cases across the board. It yielded state-of-the-art performance on benchmarks like GLUE, which evaluate models on a range of tasks that simulate human language understanding. However, BERT’s tenure at the top of the GLUE leaderboard was soon replaced by RoBERTa, developed by Facebook AI, which was fundamentally an exercise in optimizing the BERT model further, as evidenced by its full name – Robustly Optimized BERT PreTraining Approach [9]. RoBERTA surpassed BERT in terms of performance on the basis of simple modifications including training the model for more epochs, feeding more data to the model, training the model on different data (longer sequences) with bigger batch size, and optimizing the model and design choices. These simple model improvement techniques increased the model score on the GLUE benchmark from 80.5% for BERT to 88.5% for RoBERTa, a highly significant outcome. Data In earlier sections, I discussed hyperparameter optimization and select model improvement strategies. In this section, I will describe the importance of focusing on the data to improve the performance of machine learning and deep learning models. In business, more often than not, improving the quality and quantity of training data yields stronger model performance. There are several techniques for a data-centric approach to machine learning and deep learning model improvement. (1) Data Augmentation The lack of gold standard annotated training data is a common bottleneck for developing and improving large-scale supervised machine learning and deep learning models. The cost of annotation in terms of time, expense, and subject matter expertise is a limiting factor to create massive labeled training datasets. More often than not, machine learning models suffer from overfitting and their performance can be improved by using more training data. Data augmentation techniques can be leveraged to expand the training dataset in a scalable fashion. The choice of data augmentation techniques depends on the kind of data. For instance, synthetic time-series data can be created by sampling from a generative model or probability distribution that is similar in summary statistics to the observed data. Images can be augmented by altering image characteristics like brightness, color, hue, orientation, cropping, etc. Text can be augmented by a number of methods including regex patterns, templates, substitution by synonyms and antonyms, backtranslation, paraphrase generation, or using a language model to generate text. Audio data can be augmented by modifying fundamental acoustic attributes like pitch, timbre, loudness, spatial location, and other spectrotemporal features. For specific applications, pretrained models can also be used to expand the original training dataset. In earlier sections, I discussed hyperparameter optimization and select model improvement strategies. In this section, I will describe the importance of focusing on the data to improve the performance of machine learning and deep learning models. In business, more often than not, improving the quality and quantity of training data yields stronger model performance. There are several techniques for a data-centric approach to machine learning and deep learning model improvement. (1) Data Augmentation The lack of gold standard annotated training data is a common bottleneck for developing and improving large-scale supervised machine learning and deep learning models. The cost of annotation in terms of time, expense, and subject matter expertise is a limiting factor to create massive labeled training datasets. More often than not, machine learning models suffer from overfitting and their performance can be improved by using more training data. Data augmentation techniques can be leveraged to expand the training dataset in a scalable fashion. The choice of data augmentation techniques depends on the kind of data. For instance, synthetic time-series data can be created by sampling from a generative model or probability distribution that is similar in summary statistics to the observed data. Images can be augmented by altering image characteristics like brightness, color, hue, orientation, cropping, etc. Text can be augmented by a number of methods including regex patterns, templates, substitution by synonyms and antonyms, backtranslation, paraphrase generation, or using a language model to generate text. Audio data can be augmented by modifying fundamental acoustic attributes like pitch, timbre, loudness, spatial location, and other spectrotemporal features. For specific applications, pretrained models can also be used to expand the original training dataset. Recent methods based on weak supervision, semi-supervised learning, student-teacher learning, and self-supervised learning can also be leveraged to generate training data with noisy labels. These methods are based on the premise that augmenting gold standard labeled data with unlabeled or noisy labeled data provides a significant lift in model performance. It’s now possible to leverage a combination of rule-based and model-based data augmentation techniques that can be engineered at scale using data augmentation platforms like Snorkel [10]. Another common scenario where models underperform is in the context of imbalanced data across categories of interest. In such scenarios with skewed data distribution, upsampling and downsampling of data and techniques like SMOTE are helpful in correcting the modeling results. The concept of having a training dataset, validation dataset, and test dataset is common in machine learning research. Cross-validation helps in shuffling the exact composition of these three datasets so that statistically robust inference can be made about the model performance. While classical approaches focus on three datasets with a single validation dataset, it’s good to have two different validation datasets, one drawn from the same distribution as the training data and the other drawn from the same distribution as the test data. This way you can better diagnose bias-variance tradeoff and use the right set of model improvement strategies as described above. (2) Feature engineering & selection Typical machine learning models are trained on data with numerous features. Another common technique to improve machine learning models is to engineer new features and select an optimal set of features that better improve model performance. Feature engineering requires significant domain expertise to devise new features that capture aspects of the complex nonlinear function that the machine learning model is learning to approximate. So, this method is not always feasible if the baseline model already captures a diverse set of features. Feature selection via programmatic approaches can help remove some correlated or redundant features that don’t contribute much to model performance. Methods to iteratively build and evaluate a model with a progressively increasing set of features, or iteratively reducing one feature at a time from a model trained with the entire set of features, help in identifying robust features. (3) Active learning Analysis of model errors can shed light on the kind of mistakes that the machine learning model makes. Reviewing these errors helps understand whether there are any characteristic patterns that can be addressed by some of the techniques described above. Additionally, active learning methods that focus on model mistakes that are closer to the decision boundary can provide a significant boost in performance once the model is already in production. In active learning, the new examples that the model is confused about and predicts incorrectly are sent for annotation to domain experts who provide the correct labels. This dataset that is reviewed and annotated by experts is incorporated back into the training dataset to help the retrained model learn from its previous errors. Conclusion Machine learning and deep learning modeling requires significant subject matter expertise, access to high-quality labeled data, as well as computational resources for continuous model training and refinement. Improving machine learning models is an art that can be perfected by systematically addressing the deficiencies of the current model. In this article, I have reviewed a set of methods focused on models, their hyperparameters, and the underlying data to improve and update models to attain the required performance levels for successful deployment. References
Published by Neptune.ai Introduction
Only 10% of AI/ML projects have created positive financial impact according to a recent survey of 3,000 executives. Given these odds, it seems that building a profit generating ML project requires a lot of work across the entire organization, from planning to production. In this article, I’ll share best practices for businesses to ensure that their investments in Machine Learning and Artificial Intelligence are actually profitable, and create significant value for the entire organization. Best practices for identifying AI use cases Most AI projects fail at the very first hurdle – poor understanding of the business problems that can be solved with AI. This is the main bottleneck in successful deployment of AI. This problem is compounded by the early stages of organizational intuition for AI, and for how it can be leveraged to solve critical business problems [2]. What does this mean? Well, not every problem can be feasibly solved with AI. To understand if your particular problem can, you need tried and tested practices and approaches. AI use cases AI has transformed industries. It automates routine and manual processes, and provides crucial predictive insights to almost all business functions. Table 1 shows a list of some of the business use cases that have been successfully addressed using AI. Brainstorming appropriate business problems should ideally be done together with business leaders, product managers, and any available subject matter experts. The list of business problems sourced across the organization should then be vetted, and analyzed for potential solutions using AI. Not every business problem should be solved with AI. Oftentimes, a rule-based or engineered solution is good enough. Additionally, a lot of business problems can be mined from customer reviews or feedback, which typically points to broken business processes that need to be fixed. In table 2, you can see a checklist of questions, both technical and commercial, to determine whether a business problem is relevant for AI. KPIs and Metrics As part of the planning process, the appropriate model and business metric for each potential use case should be discussed. Work backwards from the expected outcome, and it’ll be easier to crystallize which particular metric to optimize. To illustrate this, in table 3 I prepared a list of AI use cases and corresponding model and business metrics. For the success of an AI project, it’s ultimately important to ensure the business metric and goals are achieved. Prioritization We have a set of business problems. They’ve been reviewed and documented after careful consideration of the criteria listed in Table 2, and analysis of appropriate business metrics as in Table 3. The candidate list of use cases needs to be prioritized, or ranked, in terms of impact and relevance to the overarching business strategy and goals. From a detailed written document describing comprehensive facets of the business use case and potential AI-based solutions, it’s useful to have objective criteria to quantify all the proposed use cases on the same scale. Here, it’s crucial for product managers and business leaders to have their own intuition about how AI works in practice, or rely on the judgment of a product-focused technical or domain expert. Whilst it’s easy to rank projects on certain success criteria, it’s not so straightforward to rate the risk associated with AI projects. A balanced metric ought to consider and weigh the likelihood and impact of a successful outcome of the AI projects versus the risk of it failing or not generating enough impact. Risks to the project might be related to organizational aspects, domain-specific aspects of the AI problem, or related to external factors beyond the remit of the business. Once a suitable balanced metric is defined, it aligns all stakeholders and leadership, who are then able to form their own subjective views based on the objective scores. A lot of factors need to be considered before a ‘yes’ or ‘no’ decision is made for a particular AI project, as well as the number of AI-relevant projects selected for a defined period. Securing buy-in from the leadership is difficult. Certain final executive decisions might appear subjective or not data-driven, but it’s still absolutely critical to go through the aforementioned planning process to present each AI project in the best light possible, and maximize the likelihood of the AI project being selected for execution. Best practices for planning AI use cases As part of the planning process with cross-functional teams, it’s important for organizations to have a streamlined mechanism for defining the AI product vision or roadmap, the bandwidth, specific roles and responsibilities of individual contributors and managers in each team, as well as the technical aspects (data pipelines, modeling stack, infrastructure for production and maintenance). In this section, I’ll describe the details of specific planning steps essential to build a successful AI product. AI product requirements For each identified use case, it’s necessary to draw the roadmap for how the product will evolve from its baseline version to a more mature product over time. In Table 4, I outline a set of essential questions and criteria to fulfil for creating a comprehensive AI roadmap for each use case. PR-FAQ (Press Release – Frequently Asked Questions) and PRD (Product Requirements Document) are two critical documents that are generally prepared during the initial stages of product ideation and conception. Pioneered by Amazon, these two documents serve as the north star for all concerned teams to align themselves with and build and scale the product accordingly. It’s absolutely essential that all stakeholder teams contribute meaningfully to these documents and share their specific domain expertise to craft a meticulous document for executive review. It’s necessary for all stakeholder team managers to review and contribute to the document, so that any team- or domain-specific intrinsic biases of product development are laid bare and addressed accordingly. Typically, teams should rely on data-driven intuition for product development. In the absence of in-house data, intuition for the AI product can be borrowed from work done by other companies or research in the same field [2, 4]. Data requirementsAs the roadmap is defined and finalized after stakeholder meetings, it’s always beneficial to have an MVP or a basic prototype of the AI product ready to validate initial assumptions and present to the leadership. This exercise also helps to streamline the data and engineering pipelines necessary to acquire, clean and process the data and train the model to obtain the MVP. The MVP should not be a highly sophisticated model. It should be basic enough to successfully transform the input data to a model prediction, and trained on a minimal set of training data. If the MVP is hosted as an API, each of the cross-functional stakeholder teams can explore the product and build intuition for how the AI product might be better developed for the end customer. From a data perspective, the machine learning team can dive deeper into the minimal training data, and do a careful analysis of the data as listed in Table 5. Model requirements After systematic assessment of the data quality, features, statistics, labels and other checks as listed in Table 5, the Machine Learning team can start building the prototype / MVP model. The best approach at the early stages of product development is to act with speed rather than accuracy. The initial (baseline) model should be simple enough to demonstrate that the model works, the data and modeling pipelines are bug-free, and the model metrics indicate that the model performs significantly better than chance. Machine learning use cases and products have become increasingly complex over the years. Whilst linear regression and binary or multi-class classification models were once too common, there are newer classes of models that are faster to train, and generalize better on real-world test data. For the ML scientist or engineer, no two use cases may be built using an identical tech stack of tools and libraries. Depending on the characteristics of the data relevant for the AI use case (see Table 2), the data science team must define the modeling stack specific to each use case (see Table 6 below). Best practices for executing AI use cases After identifying and planning for promising AI use cases, the next step is to actually execute the projects. It might seem that execution is a straightforward process, where the machine learning team gets to weave their magic. But, simply ‘building models’ is not enough for successful deployment. Model building has to be done in a collaborative and iterative fashion:
In the next section, I will discuss the best practices for the operational aspects of executing and deploying AI models successfully and realizing the proposed commercial value. Reviews and feedback Once the AI project has kickstarted, it’s essential for the machine learning team to have both periodic as well as ad-hoc review meetings with stakeholders, including product teams and business leadership. The documents prepared during the planning phase (PR-FAQ and PRD) serve as the context in which any updates or changes should be addressed. The goal of regular meetings is to assess the state of progress vis-a-vis the product roadmap, and address any changes in:
While planning is important, most corporate projects don’t go as initially planned. It’s important to be nimble and agile, respond to any new information (regarding technical, product or business aspects), and re-align towards a common path forward. For example, the 2020 lockdowns severely impacted the economy. In light of such high-impact unexpected events, it’s critical to adapt and change strategy for AI use cases as well. In addition to regular internal feedback, it’s good to keep in touch with the end users of the product throughout the AI lifecycle. In the initial stages (user research, definition of target user personas and their demographics), and especially in product design and interaction with the model predictions. A core group of users from the target segment should be maintained to obtain regular feedback across all stages of product development. Once an MVP is ready, users can be very helpful in providing early feedback that can often bring to light several insights and uncover any biases or shortcomings. When the AI model is ready to be shipped and different model versions are to be evaluated, user feedback can again be very insightful. User insights about the design, ease of use, perceived speed and overall user flow can help the product team to refine the product strategy as needed. Building iterativelyFrom the technical perspective, the model building process is usually an iterative one. After establishing a robust baseline, the team gets insight into how far the model performance is from the established acceptance criteria. In the early stages of model building, the focus should primarily be on accuracy rather than latency. At each stage of model development, a comprehensive analysis of model errors on the validation set can reveal important insights into the model shortcomings, and how to address them. The errors should also be reviewed in conjunction with subject matter experts, to evaluate any errors in data annotation as well as any specific patterns in the errors. If the model is prone to a particular kind of error, it might need additional features. Or it might need to be changed to a model based on a different objective function, or underlying principle, to overcome these errors. This repetitive process helps the machine learning team to consolidate their intuition about the use case, think outside the box, and propose new creative ideas or algorithms to achieve the desired metrics. During the course of model building, machine learning practitioners should systematically document every experiment and the corresponding results. A structured approach is helpful not only for the particular use case, but also helps build organizational knowledge that can be helpful to onboard new hires, or serve as shining examples of successful AI deployment. Deployment and maintenance Once the candidate machine learning model is ready and benchmarked thoroughly on the validation and test sets, errors analyzed, and the acceptance criteria met, the model may be taken to production. There’s a huge difference between the model training and deployment environments. The format in which the model is trained may not be compatible with taking the model to production, and need to be appropriately serialized and converted to the right format. In an environment that simulates the production settings, model accuracy and latency should be validated again on the hold-out dataset. Deployment should be done incrementally by surfacing the model to a small portion of real-world traffic or input to the model, ideally to be tested first by internal or core user groups. Once the deployment pipeline has been rigorously tested and vetted by the MLOps team, more traffic can be directed to the model. In scenarios where one or more candidate models are available, A/B testing of these models should be done systematically, and evaluated for statistically significant differences to determine the winning model. Post-deployment, it’s important to ensure that all the input-output pairs are collected and archived appropriately within the data ecosystem. The launched model should be periodically assessed and the distribution of the real-world data compared with the distribution of the training data to assess for data and model drifts. In such cases, an active learning pipeline that feeds some of the real-world test samples back into the original training dataset helps to alleviate the shortcomings of the deployed model. Finally, once the model production environment and all pipelines are stable, the machine learning and product teams should evaluate the business metrics and KPIs to assess whether the metrics meet the predefined success criteria or not. In case it does, then only can the use case be deemed to be a success and a summary of the overall use case and results should be documented and shared internally with every stakeholder and the business leadership. Wrapping up If machine learning, product and business teams in startups and enterprises adopt a systematic approach and follow the best practices as laid out in this article, then the likelihood of successful AI outcomes can only increase. Adequate upfront preparation is crucial. Without it, teams won’t be able to rectify any errors or respond to changes, nor realize the massive commercial potential that AI can deliver. References
Published by Neptune.ai Introduction
In this article, I have documented the best practices and approaches to build a productive Machine Learning team that creates positive business impact and generates economic value within corporate entities, be it startup or enterprise. If you do Machine Learning, either as an individual contributor or team manager, I’ll help you understand your current team structure and how to improve internal processes, systems and culture. We’ll explore how to build truly disruptive ML teams that drive successful outcomes. Why build an ML team? Artificial Intelligence (AI) is predicted to create global economic value of nearly USD 13 Trillion by 2030 [1]. Most companies across diverse industries and sectors have realized the potential value of AI, and are well on the way to becoming an AI-first entity. From tech companies building cutting-edge AI products like self-driving cars or smart speakers, to traditional enterprises leveraging AI for non-glamorous use cases like fraud detection or customer service automation, the potential of AI to deliver commercial impact is beyond doubt. The adoption of AI in industry is accelerated by a number of trends:
In the following section, I will describe the challenges in building Machine Learning teams for startups and enterprises respectively. Challenges for startups Startups, in the early stages of operations, are typically bootstrapped and have limited budgets to deploy for building machine learning teams. If your startup has a core product or service founded on AI, then it’s imperative to hire machine learning talent early on to build the MVP, and raise funding to hire more talent and scale the product. On the other hand, for startups whose core product or service is focused on other domains like finance, healthcare or education, AI will either be incidental to the core operations, or not essential until product-market fit is achieved. The main challenges of building ML teams in startups are:
In the face of such daunting challenges of machine learning work combined with general organizational challenges at startups [2], it becomes even more important for startups to hire and build the right machine learning team from the very beginning. Challenges for enterprise Unlike startups, big organizations and enterprises don’t suffer from lack of funding or budget to seed a machine learning team. The challenges in an enterprise are unique from one entity to another, but generally arise due to the size of the organization, internal bureaucracy and slower decision making processes – things that tend to benefit startups and help them ship products faster. Although today, it might appear that technology companies are ubiquitous, they’re still a minority compared to the vast number of traditional enterprises focused on diverse sectors like finance, FMCG, retail, healthcare, education and so on. Technology companies have a headstart when it comes to machine learning and AI, and their strong early focus and investment in AI R&D will ensure their dominance compared to their traditional counterparts. However, there are numerous challenges that traditional enterprises face in adopting and onboarding AI across the organization [3], which more often than not result in failed AI projects and reduced trust in the capacity and potential of AI [4]:
Profiles in a Machine Learning team Modern machine learning teams are truly diverse. Yet, at the core, they involve candidates who have strong analytical skills and the ability to understand data from different domains, train and deploy predictive models, and derive business or product insights from the same. SCOPING The first stage of scoping out an AI use case requires AI experts along with business or domain experts. Plenty of successful AI projects start with a deep understanding of the potential business problems that can be solved with AI, and require the combined intuition and understanding of seasoned technical and business experts. In this stage, the usual collaborators involve business leaders, product managers, AI team managers and perhaps one or more senior data scientists with deep, hands-on experience with the underlying data. DATA The second stage is focused on acquiring data, cleaning, processing from the raw form to structured format and storing it in specific on-premise databases or cloud repositories. In this stage, the role of the data engineer is prominent, alongside data scientists. The business and product managers serve a helpful role in providing access to the data, metadata and any preliminary business insights based on rudimentary analytics. MODELING The third stage involves core data science and machine learning modeling using the datasets prepared in the previous stage. In this stage data scientists, applied or research scientists are predominant in training initial models, refining them based on test set performance and feedback from cross-functional stakeholders, developing new algorithms if needed, and finally producing one or more candidate models that meet the required accuracy and latency benchmarks to take the models to production. DEPLOYMENT The final stage of the machine learning lifecycle is focused on deploying trained models to production, where they serve predictions from the inputs received from end users. In this stage, machine learning engineers take the models developed by the data/applied/research scientists and prepare them for production. If the models meet the predefined accuracy and latency benchmarks, the models are good to go live. Otherwise, ML engineers work on optimizing the model size, performance, latency and throughput. Models go through systematic A/B testing procedures before deciding which version(s) of the models are best suited for deployment. Next, I prepared detailed profiles for the different types of experts you may need for your ML team. Data Engineer Skills
Responsibilities
Tech stack
Data Scientist Skills
Responsibilities
Tech stack
Machine Learning Engineer Skills
Responsibilities
Tech stack
Research Scientist Skills
Responsibilities
Tech stack
Product Manager + Business Leader Skills
Responsibilities
Tech stack
Data Science / Machine Learning Manager Skills
Responsibilities
Tech stack
Building productive and impactful Machine Learning teams We explored the typical composition of a Machine Learning team, which includes a variety of different profiles specialized in specific aspects of building machine learning projects. However, the reality on the ground is that having a solid machine learning team is not a guarantee that the team will create and deliver massive business impact. The reality on the ground is that the vast majority of corporate AI projects fail, and a lot of these projects fail despite having a great machine learning team. In this section, I will dive deeper into the cultural, procedural and collaborative aspects of building impactful machine learning teams from first-principles. The success of a machine learning team is founded on several factors related to systems, processes, and culture. When built the wrong way, this will inevitably lead to failed projects and erosion of trust and confidence in the team, as well as machine learning as a business capability and competitive edge. 1. Working on the right AI use cases For a brand new machine learning team to deliver impact in an organization, it’s paramount that the team starts off on the right foot. Early traction is critical to build trust in the organization, evangelize the potential of AI across business verticals, and leverage early successes to deliver riskier or moonshot projects with greater impact. 2. Planning for success – measuring impact As part of the process of selecting and defining the right AI use cases, it’s fundamental to critically assess and evaluate the business impact and return on the investment in the particular machine learning project. The best approach for evaluation is by defining a set of metrics that address several aspects of the project and its potential impact. Technical metrics For classification models:
For regression models:
For deep learning models (depends on the particular application):
Business metrics Business metrics are defined by first-principles, and are often downstream metrics that are impacted by the machine learning models. For measuring outcomes, it’s crucial to a priori identify the relevant business metrics and track the effect of the machine learning models on the same during A/B testing, deployment, and continuously monitor live models. Standard business metrics aim to capture levels of trust, satisfaction, faults, and SLAs, among others. Once a candidate set of machine learning projects is scoped, defined and formulated from conception to production with associated set of metrics, each project needs to be evaluated by leadership teams from the perspective of high-level organizational goals to be achieved in a defined time period. Leaders need to balance the business impact (on the opline or bottomline), budget, team bandwidth, time savings, efficiency savings, and the urgency for delivering projects in the short-term vs. the long term. Executives need to incorporate multiple factors to arrive at a carefully considered decision to give the green signal for one or more machine learning projects. 3. Structured processes – Agile, Sprints Once a project is defined and has the go ahead from the leadership team, it is important to ensure that systems and structured processes are in place to ensure that the machine learning team can work unhindered and execute the project in a timely fashion as per the agreed plan. Key operational infrastructure like data warehouse, database management systems, data ETL pipelines, metadata storage and management platforms, data annotation frameworks and availability of labeled data, access to compute on-prem or in the cloud, licensed as well as open source tools and softwares that streamline the model training process, machine learning experiment, results and metadata management tools, A/B testing platforms, model deployment infrastructure and solutions, continuous model monitoring and dashboards are integral for a smooth data processing, model building, and deployment workflow. However, the existence of such key skeletal infrastructure for machine learning varies from one organization to another depending on how mature the machine learning organization or the company is. Apart from the infrastructure, processes related to planning tasks of the individual contributors of the project using sprints and agile frameworks need to be hardwired and accessible to all stakeholders of the project. While Agile processes have worked well for software projects, machine learning projects are different and may not be that well suited to the same frameworks. Although similarities like iterative model building and refining based on feedback exist, machine learning projects are more sophisticated, as the fundamental blocks include data and models in addition to code. While software engineering best practices like code review and versioning are very well established, the same rigor and structure is not always applied to data and machine learning models. Documentation is another aspect that is even more critical to keep track of multiple hypotheses, experiments, results and all the moving parts associated with machine learning projects. In the absence of well entrenched tools and best practices, most data science work tends to be highly inefficient where data scientists end up spending a lot of time on routine chores that can be automated. It’s imperative that managers try to reduce such barriers to more efficient and productive work, so that the machine learning teams can focus exclusively on their work. 4. Clear communication within and across teams Communication is an essential skill for data scientists. Machine learning is a more intricate discipline and the end results might often be too obscure for generalist and non-technical managers of data science, product or business teams to comprehend easily. However, communication is just the tip of the iceberg, and many more interpersonal skills like persuasion, empathy, collaboration are exercised on a regular basis whilst working in cross-functional teams. Writing emails of results or updates or slide presentations to stakeholders and leadership, live demos, expounding the project for product review documents, writing up the entire project for a blog meant for lay audience or for a journal or conference meant for a technical audience, requires strong writing skills. Typical data scientists may be more proficient in writing code than words, so the organization should invest in corporate training programs for data scientists that include training in written and spoken communication skills. Oral communication skills can’t be underestimated either, and are increasingly important in remote-first organizations. Effective stakeholder management involves building rapport and trust and establishing clear channels of communication, which is much harder to do if a data scientist is not able to speak and communicate clearly in an engaging and delightful manner. Although a lot of workplace productivity apps have created digital channels of reduced in-person communication, the power of live in-person communication with peers, stakeholders and leaders often gets the job done faster. Clear communication destroys information silos, so that each stakeholder is aware, updated and aligned with the progress of various machine learning projects. Regular meetings are important to have checks and balances, in addition to documented progress in tools to ensure that projects are moving in the right direction. 5. Effective collaboration with business Machine learning teams are typically part of the engineering or technology organizations in a company. While this makes natural sense for effective collaboration across colleagues from data, analytics, engineering functions, regular interaction with business teams is a must. Given the fact that most machine learning models are built on historical ‘business’ data that can change in a predictable manner due to new product or feature launches or seasonality patterns, as well as in an unpredictable manner, for instance, during Covid-19 lockdowns, machine learning teams must have a real-time awareness of how the business data is changing on the ground. Not only is it important to adjust the underlying hypotheses in the face of massive changes in customer behavior or new product launches, but also to correct the planned course of action if initial assumptions are violated or the data changes too dramatically for the machine learning models to be relevant or have the same impact as before. Business teams are in the best position to give feedback on early prototypes based on their domain expertise, validate new assumptions or ideas by doing customer research and surveys, and evaluating the impact of deployed machine learning models. For these reasons, the partnership between machine learning and business teams needs to be mutually beneficial and symbiotic. Leaders of machine learning teams need to build close ties with business teams and encourage team members to do the same. 6. Creating a culture of innovation For long-term success of machine learning teams, apart from working on the right use cases and facilitating collaborative work across the organization, it’s imperative to build a culture that embraces and rewards innovation. Here, leadership should lead by example and encourage innovation and R&D across different business verticals. For a machine learning team, it’s critical to make a mark in the ecosystem through patent applications, journal or conference publications, outreach and dissemination via meetups, workshops, seminars by leading experts, collaboration with startups and academic organizations as needed, and so on. Most organizations don’t focus on building such a thriving culture that promotes exchange and cross-fertilization of new ideas and technologies, which can often impact current organizational processes and thinking in a substantial way. Leaders also need to build strong diverse teams and hire new talent, from entry level graduates to experienced engineers and scientists. The inflow of new talent brings in novel ideas that can positively impact the work culture. Otherwise stasis sets in, teams can become narrow-minded, and decline in their capacity to innovate and launch impactful products. Meritocratic executive decisions strongly impact culture, both in terms of promoting talent that demonstrates a consistent track record of exceptional bar-raising work, as well as letting go of non-performing individuals or managers. The appropriate balance and culture in a team is an ongoing process, but it’s important for leaders to ensure that at no point in time, the members of a machine learning team are unmotivated and uninspired by the systems, processes, and culture within the organization. 7. Celebrating and sharing AI success stories Finally, given the low odds of success for AI projects at present, it’s important to make sure that any AI success stories are widely shared within the organization to attract the attention of other business teams who could potentially partner with the machine learning team. Furthermore, given the immense popularity of AI as a discipline, success stories might also attract potential new team members from within the company who feel motivated to upskill in machine learning and become a data scientist. It’s important to recognize the effort of the core contributors to the success of AI projects in a public manner within the company and not behind closed doors. It helps to build morale and confidence and foster a meritocratic culture within the team that will help them in their career development. Additionally, wherever possible, the leadership should take steps to share such AI success stories widely within the broader ecosystem in which the company operates, for instance, via company blogs, social media posts, podcasts or talks at meetups, workshops or conferences. For a machine learning team to continue to deliver strong performance and results, it’s critical to build a portfolio of successful projects starting from simpler ones to gradually more sophisticated ones with an ever increasing scope and commercial impact. The success of a machine learning team acts as a trigger and accelerates the digital and AI transformation of a company. In the highly competitive digital economy, companies that have invested early and invested a lot in AI have emerged as the early winners, for instance, the big tech companies. Thus, impactful machine learning teams act as a lever in the journey towards embracing and onboarding AI and transforming the company into a forward-looking, data-driven, AI-first company. References
Published in BecomingHuman.ai tldr: Poor processes and culture can derail the success of many an exceptional AI team In part 1, I introduced a four-pronged framework for analysing the principal factors underlying the failure of corporate AI projects:
In the second part of the blog series, I will focus on core aspects of organizational processes and culture that companies should inculcate to ensure that their AI teams are successful and deliver significant business impact.  Figure 1. The Facade Culture (source: Dilbert.com) Culture Organizational culture is the foundation on which a company is built and shapes its future outcomes related to commercial impact and success, hiring and retention, as well as the spirit of innovation and creativity. Whilst organizational behaviour and culture have been studied for decades, it needs to be relooked in the context of new-age tech startups and enterprises. The success of such cutting-edge AI-first companies is highly correlated with the scale of innovation through new products and technology, which necessitates an open and progressive work culture. Typically, new startups on the block, especially those building a core AI product or service, are quick to adopt and foster a culture that promotes creativity, rapid experimentation and calculated risk-taking. Being lean and not burdened by any legacy, most tech startups are quick to shape the company culture in the image of the founders’ vision and philosophy (for better or worse). However, the number of tech companies that have become infamous for the lack of an inclusive and meritocratic culture are far too many. There are innumerable examples, from prominent tech startups like Theranos, Uber to big tech companies like Google and Facebook, where an open and progressive culture has at times taken a back seat. However, with the increasing focus on sustainability, diversity and inclusion, and ESG including better corporate governance, it is imperative for tech companies to improve organizational culture and not erode employee, consumer or shareholder trust or face real risks to the business from financial as well as regulatory authorities as recently experienced by BlackRock and Deliveroo. Here is a ready reckoner of some of the ways AI companies tend to lose sight of culture:
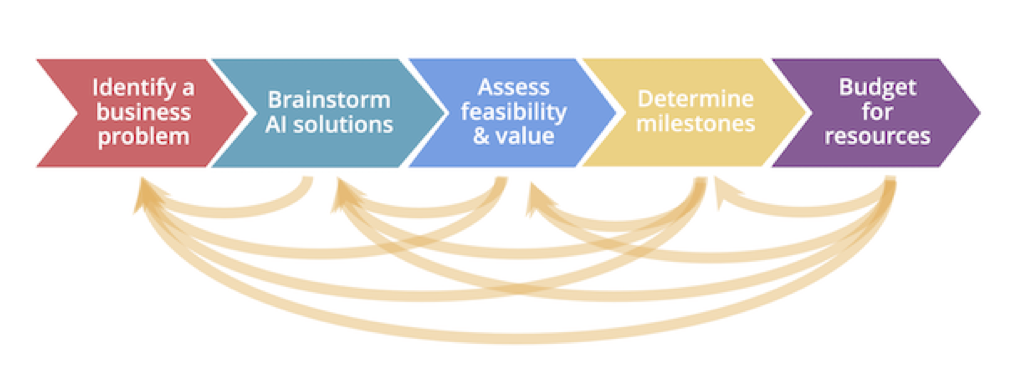 Figure 2. How to scope AI projects (source: DeepLearning.ai) Process There are several processes that are integral for ensuring a successful AI outcome across the entire lifecycle from conception to production. However, from first-principles, the primary process that needs to be streamlined and managed well is identifying the right use cases for AI that have the potential to create significant commercial impact. In this blog, I will focus only on this particular aspect and expound on the other processes in separate blogs. What can go wrong in identifying the right set of AI use cases?
So, having listed a variety of issues that can go wrong in identifying an AI use case, how should one ideally go about scoping AI projects systematically? As per Figure 2, the strategy to scope an AI use case involves 5 steps: from identifying a business problem to brainstorming AI solutions to assessing feasibility and value to determining milestones and finally budgeting for resources. The scoping process starts with a careful dissection of business, not AI problems, that need to be solved for creating commercial value. As discussed above, if not done right, the rest of the AI journey in an organization is bound to fail. Secondly, it is important to brainstorm potential AI solutions across AI, engineering and product teams to shortlist a set of approaches and techniques that are practically feasible instead of going with the latest or most sophisticated AI model or algorithm. Thirdly, AI teams should assess the feasibility of shortlisted methods by creating a quick prototype, validating the approach based on literature survey or discussions with domain experts within the company or partner with external collaborators accordingly. If a particular method does not appear to be feasible, then teams should consider the alternative approaches until they are ruled out. Once the initial efforts have validated the use case, its feasibility and potential approaches, it is critical to define key business metrics, KPIs, acceptance or success criteria. These are not composed of the typical AI model metrics like precision, accuracy of F-1 score, but KPIs need to be defined that are directly correlated with the impact of the AI models on business goals e.g. retention, NPS, customer satisfaction amongst others. The final step involves program management of the entire project from allocating time, bandwidth of individual contributors in the AI as well as partner teams, budget for collecting or labeling data, hiring data scientists or buying software or infrastructure to setup and streamline the entire AI lifecycle. Tldr part 2:
Before you head out to build AI, first ask what are the business problems that are big enough and suitable for an AI-based solution? What business metrics and objectives ought to be targeted? Scope out the problem systematically to ensure the best chance of success. Build on the initial successes of AI and foster a meritocratic and open culture of innovation and cross-functional collaboration to build AI that solves a variety of business use cases. Published in BecomingHuman.ai Tldr: Corporate AI failures can be ascribed to poor Intuition, Process, Systems, People The promise of AI is real. We are at the crossroads of the next industrial revolution where AI is automating industrial processes and technologies that were hitherto considered state-of-the-art. AI is expected to create global commercial value of nearly USD 13 Trillion by 2030 (McKinsey Global Institute). Given the immense commercial value that AI can unlock, it is no surprise that businesses of all kinds and sizes have jumped on the AI bandwagon and are repositioning themselves as ‘AI-first’ or ‘AI-enabled.  Source: Dilbert (https://dilbert.com) However, the groundbreaking progress and transformation that AI has brought across industry belies the stark reality of an increasing number of failed AI projects, products and companies (e.g. IBM Watson, and many more).
How can startups and large enterprises battle these tough odds to drive innovation and digital transformation across the organization? In this blog, I will examine from first principles common themes that typically underlie failed AI projects in corporations, and questions business leaders and teams should address when embarking on AI projects. I have classified these under four broad areas and will tackle each of these themes individually in future blog posts:
Part 1: Intuition (Why) Commercial AI projects often fail due to a lack of organizational understanding of the utility of AI vis-a-vis the business problem(s) to be solved. More often than not, throwing a complex AI-based solution at a problem is not the right approach, where a simpler analytical or rule-based solution is sufficient to have things up and running. It is therefore paramount to decode the business problem first and ask whether an AI approach is the only and best way forward. Unlike software engineering projects, the fundamental unit of AI is not lines of code, but code and data. In an enterprise, data typically belongs to a particular business domain, and is generated by the interaction of customers with specific business products or services. Here, a customer-centric approach is critical to understand the context in which this data is generated so that AI models may be developed to predict or influence user behavior to meet well-defined business objectives with clear success criteria. Wherever possible, the data scientists should themselves use and experiment with their company’s products/services by donning a ‘customer’s hat’ to decode the customer mindset. It’s hard to understand the nuances of training data if you don’t intimately understand the customer ‘persona’ to begin with. Data reflects more than just mere numbers. Making sense of data requires a holistic cross-functional understanding from a business, product, customer as well as technical perspective. Typically, these functional roles are played by different teams within a company, necessitating a strong collaborative effort to demystify the business problem, question the existing solutions and come up with new hypotheses, test and prove or disprove these hypotheses quickly via iterative experiments to hone in on a feasible solution and strategy. Here, the importance of domain knowledge or subject matter expertise cannot be stressed enough. It takes years to gain deep domain expertise which enables practitioners to develop better intuition for the business problem and the underlying data to propose feasible solutions or strategies. As data scientists typically lack expertise in business domains, it is imperative they complement their algorithmic data science skills with expert knowledge from those who work closely with the customer and understand the business problem intimately. Tldr (Part 1/4): Ask why is AI needed for your business problem? Is it the only way to solve the problem? And if yes, build and test hypotheses by leveraging the collective organizational knowledge and intuition across cross-functional teams that specialize in data science, business, product, operations. Published in Towards Data Science Preview:
TLDR (or TL;DR) is a common internet acronym for “Too Long; Didn’t Read.” It likely originated on the comedy forum Something Awful around 2002 (source) and then became more popular in online forums like Reddit. It is often used in social media where the author or commenters summarise lengthy posts and provide a TLDR summary of one or two lines as a courtesy to other readers. TLDRs help readers get the gist of the information and enable quick informed decisions on whether to invest the time in reading the full post. With Natural language processing (NLP) and automatic text summarization systems, TLDR generation can be automated. Automatic text summarization is a challenging problem of generating a shorter summary of a long document while preserving its essence. It has wide practical applications in multiple domains such as legal contract analysis, search (summarising use information in websites, entity-centric summarization from Wikipedia articles), question answering systems, media (generating news headlines, summarising articles in newsletters), marketing (generating copy, slogans) among others. Automatically generated text summaries help reduce reading time, are non-biased compared to human authored summaries, and could also be beneficial for a lot of personal day to day applications like email summarization, TLDR generation for posting on social media sites like Twitter, and more. 👉 Here is the full article Published in KDNuggets Introduction
Coughing and sneezing were believed to be symptoms of the bubonic plague pandemic that ravaged Rome in the late sixth century. The origins of the benevolent phrase, “God bless you,” after a person coughs or sneezes is often attributed to Pope Gregory I, who hoped that this prayer would offer protection from certain death. The flu-like symptoms associated with the plague co-occur during the current Covid-19 pandemic as well, to the extent where “normal” coughs draw immediate alarm and concern. However, in the present technologically advanced times, we need not resort only to prayers. We can now build sophisticated AI models that learn complex acoustic features to distinguish between cough sounds from Covid-19 positive and otherwise healthy patients. Since the start of the Covid-19 pandemic, multiple AI research teams have been working towards leveraging AI to improve screening, contact tracing, and diagnosis. Most of the preliminary work involved CT or X-ray scans [1,2,3,4] to diagnose Covid-19 faster and, in some cases, with better accuracy than the RT-PCR test. Recently, AI researchers have started testing cough sounds for preliminary diagnosis or a prescreening technique for Covid-19 detection in asymptomatic individuals. This is beneficial because, while someone may not have noticeable symptoms, the virus may still cause subtle changes in their body that may be detected by specific algorithms combining audio signal processing and machine learning. Cough-based audio diagnosis is non-invasive, cost-effective, scalable, and, if approved, could be a potential game-changer in our fight against Covid-19. This technology might also prove to have better efficacy than the standard strategy of prescreening for Covid-19 on the basis of temperature, especially for asymptomatic patients. The intuition behind using cough sounds Cough, along with fever and fatigue, is one of the key symptoms of Covid-19 [5]. Studies have shown that cough from different respiratory ailments has unique characteristics due to the different nature and location of the underlying irritants [6]. Though a human ear cannot differentiate these features, AI models can be trained to learn these features and discriminate between a cough from a Covid-19 positive and negative patient. One of the significant challenges is the availability of the right quantity and quality of data to build an AI model that can make robust predictions about the underlying medical ailment based on cough sounds. Cough is, unfortunately, a common symptom of many respiratory and non-respiratory diseases (see Figure 2). Hence, an AI model must also learn to distinguish coughs related to Covid-19 from coughs caused by other respiratory ailments. The prediction of such AI models could be considered as such or be further substantiated by other clinical tests, for instance, an RT-PCR screening test. Since spring 2020, AI researchers have collected cough sound data from the general public via mobile apps and websites and developed AI solutions for cough-based prescreening tools. Some of these works include - AI4Covid-19 [6] from the University of Oklahoma, Covid-19 sounds [7] from the University of Cambridge, Coswara [8] from IISC Bangalore, Cough against Covid-19 [9] from Wadhwani AI, Covid-19 Voice detector [10] from CMU, COUGHVID from EPFL [11], Opensigma from MIT [12], Saama AI research [13] and UK startup Novoic amongst others. While the cough data in the AI4Covid-19, Cough against Covid-19, and Saama AI research projects are collected in a controlled setting or collected from hospitals under clinical supervision, Coswara, Covid-19 sounds, and COUGHVID, MIT’s project, use crowdsourced and uncontrolled data collected through their websites or app. The website/app records forced coughs (Coswara also collects more audio - breathings sounds, vowel pronunciations, counting numbers from one to twenty) and gather useful metadata like age, gender, ethnicity, and health status information, like details of a recent Covid-19 test, current symptoms, and health status, like the occurrence of diabetes, asthma, heart disease, amongst others. The AI4Covid-19, Covid-19 sounds, and Saama AI research projects also train models to differentiate Covid-19 cough sounds from non-Covid-19 infection coughs like pertussis, asthma, and bronchitis. MIT researchers used features from their previous work to detect Alzheimer’s from cough sounds [14] and fine-tuned their AI model to detect Covid-19 from a healthy person’s cough. The connection between Covid-19 and the brain with recently reported symptoms of neurological impairments in Covid-19 patients led authors to test the same biomarkers - vocal cord strength, sentiment, lung performance, and muscular degradation for detecting Covid-19 coughs. “Our research uncovers a striking similarity between Alzheimer’s and Covid-19 discrimination. The exact same biomarkers can be used as a discrimination tool for both, suggesting that perhaps, in addition to temperature, pressure, or pulse, there are some higher-level biomarkers that can sufficiently diagnose conditions across specialties once thought mostly disconnected.” [11] Once an AI model is trained, it can be incorporated into a user-friendly app where users can log in and submit their cough sounds via their phones to get instant results. The model prediction can be used to ascertain whether a user might be infected and follow-up to confirm with a formal test like RT-PCR. Figure 5 shows an overview of the architecture developed by the AI4covid-19 team. It includes a cough detection model to check the quality of the cough sound and prompts the user to re-record in case of noisy recording or non-cough sound. The detected cough is then sent to Covid-19 diagnosis model(s) to discriminate between a cough from a Covid-19 positive and negative patient. The preliminary results of most of the teams look promising and confirm the hypothesis that cough sounds contain unique information and latent features to aid diagnosis and prescreening for Covid-19. The MIT lab has collected around 70,000 audio samples of different coughs with 2,500 coughs from confirmed Covid-19 positive patients. The trained model correctly identified 98.5% of people with Covid-19 and correctly ruled out Covid-19 in 94.2% of people without the disease. For asymptomatic patients, the model correctly identified 100% of people with Covid-19, and correctly ruled out Covid-19 in 83.2% of people without the disease. Cambridge’s Covid-19 sounds project reported an 80% success rate in July 2020. In spite of the similar acoustic modeling pipeline and deep learning approaches, it is difficult to compare these preliminary results across these projects as each AI model is trained using distinct datasets (owing to the scarcity of publicly available datasets to different benchmark works). Since cough also covaries with age and gender, it is important to collect diverse data to make any AI solution generalize across patient populations around the world and accepted as a standard non-invasive prescreening tool for Covid-19. The data collection for most of the projects is still ongoing, and readers are suggested to check out these websites, donate coughs, and help save lives: Covid-19 sounds, Coswara, Cough against Covid-19, Covid-19 Voice detector, COUGHVID, Opensigma, Novoic, and AI4COVID-19. References: [1] L. Wang, A. Wong ‘‘Covid-19-Net: a tailored deep convolutional neural network design for detection of Covid-19 cases from chest radiography images,’’ (2020) arXiv preprint arXiv:2003.09871vol. 1 [2] Zhang I, Xie Y, Li Y, Shen C, Xia Y. ‘‘Covid-19 screening on chest X-ray images using deep learning based anomaly detection,’’. 2020. arXiv preprint arXiv: 2003.12338. [3] Li L, Qin L, Xu Z, Yin Y, Wang X, Kong B, Bai J, Lu Y, Fang Z, Song Q, et al. ‘‘Artificial intelligence distinguishes Covid-19 from community acquired pneumonia on chest ct. ’’ Radiology; 2020. 200905 [4] Zhao W, Zhong Z, Xie X, Yu Q, Liu J. ‘‘Relation between chest ct findings and clinical conditions of coronavirus disease (Covid-19) pneumonia: a multicenter study. ’ American Journal of Roentgenology 2020:1–6. [5] WHO. 2020b. Q&A on coronaviruses (COVID19). https://www.who.int/emergencies/diseases/novelcoronavirus-2019/question-and-answers-hub/q-a-detail/qa-coronaviruses. Accessed: 2020-11-17. [6] Imran, Ali, et al. "AI4COVID-19: AI enabled preliminary diagnosis for COVID-19 from cough samples via an app." (2020) arXiv preprint arXiv:2004.01275 [7] Brown, Chloë, et al. "Exploring Automatic Diagnosis of COVID-19 from Crowdsourced Respiratory Sound Data." (2020) arXiv preprint arXiv:2006.05919 [8] Sharma, Neeraj, et al. "Coswara--A Database of Breathing, Cough, and Voice Sounds for COVID-19 Diagnosis." (2020) arXiv preprint arXiv:2005.10548 [9] Bagad, Piyush, et al. "Cough Against COVID: Evidence of COVID-19 Signature in Cough Sounds." arXiv preprint arXiv:2009.08790 (2020). [10] Deshmukh, Soham, Mahmoud Al Ismail, and Rita Singh. "Interpreting glottal flow dynamics for detecting COVID-19 from voice." arXiv preprint arXiv:2010.16318 (2020). [11] Orlandic, Lara, Tomas Teijeiro, and David Atienza. "The COUGHVID crowdsourcing dataset: A corpus for the study of large-scale cough analysis algorithms." arXiv preprint arXiv:2009.11644 (2020). [12] Laguarta, Jordi, Ferran Hueto, and Brian Subirana. "COVID-19 Artificial Intelligence Diagnosis using only Cough Recordings." IEEE Open Journal of Engineering in Medicine and Biology (2020). [13] Pal, Ankit, and Malaikannan Sankarasubbu. "Pay Attention to the cough: Early Diagnosis of COVID-19 using Interpretable Symptoms Embeddings with Cough Sound Signal Processing." arXiv preprint arXiv:2010.02417 (2020). [14] J. Laguarta, F. Hueto, P. Rajasekaran, S. Sarma, and B. Subirana, “Longitudinal speech biomarkers for automated alzheimer’s detection,” Cognitive Neuroscience, Preprint, pp. 1–10, 2020. https://www.researchsquare.com/article/rs-56078/latest.pdf Published in BusinessWorld The promise of AI is real. Research from Accenture posits that AI could add $ 957 billion to the Indian economy and raise India’s income by 15 percent in 2035. Globally, the economic value that AI is expected to create close to $ 13 trillion by 2030. However, the stark reality is that India has close to 100,000 vacant data scientist jobs as of today, with the demand for AI-centric roles set to increase exponentially. How can India possibly unlock this massive economic potential of AI, without an established talent pipeline?
The lack of an established AI talent pipeline for a rapidly modernizing economy like India is alarming. While India has a working age population of close to 589 million, only 49 percent are said to possess digital skills, with the proportion of those able to understand and build AI products is far lower (World Economic Forum). Although the supply of engineering talent is steady, the nature of the rapidly changing jobs landscape means that core engineering jobs are transforming into digital roles that require strong software engineering and programming skills. Not only Indian universities have failed to keep pace with adapting the course curricula to the skills requirements of the modern data-driven industries but the consequences of not training candidates in fundamental data skills and leadership skills to build collaborative AI projects can be even more damaging to the economy in the long run. Academia suffers from an acute shortage of expert faculty to train students in state-of-the-art AI theory and practical knowledge at scale. This burden of nurturing and creating AI talent does not rest solely with educational institutions. Industry needs to step up and actively contribute by sharing business data, a critical ingredient for building data-hungry supervised AI systems, and foster a vibrant and collaborative ecosystem by partnering with both academia and startups to raise awareness of the kind of challenging business problems that only AI can solve effectively. To bridge the gap between industry requirements of AI talent and lack of industry- oriented AI education at universities, a number of edtech startups have stepped up. The majority of online edtech platforms focus on programming and coding skills, a key foundational skill to building AI systems. However, the pedagogical methods practised by most suffer from lack of imagination and creativity and do not innovate beyond offering the age-old offline classroom content via online platforms - the adage ‘old wine in a new bottle’ comes to mind. AI is a multidisciplinary field that requires strong creative, scientific and problem solving abilities to come up with novel solutions to pressing business problems. The ability to innovate beyond open-source models and solutions is fundamental to building tailored customer-centric AI solutions that incorporate the unique business and cultural context of India. If India is not able to keep pace with AI global superpowers like the USA and China, then not only is she at risk of lagging behind in the battle for tech supremacy but also faces the dire prospect of losing its emerging tech talent to countries that offer better opportunities to work at the cutting edge of AI. India is set to become the world’s youngest country with 64 percent of its population in the working age group, while western countries, China and Japan have an aging demographic. India must therefore implement policy changes, state-wide reskilling initiatives in cooperation with industry, academia and startups to reskill the nation’s youth in the latest digital and AI-first skills to steer India into the next decade as a leading digital economy. Published in Towards Data Science Introduction
Electronic means of communication have helped to eliminate time and distance barriers to sharing and broadcasting information. However, despite all its advantages, faster means of communication have also resulted in the extensive spread of misinformation. The world is currently going through the deadly COVID-19 pandemic and fake news regarding the disease, its cures, its prevention, and causes have been broadcast widely to millions of people. The spread of fake news and misinformation during such precarious times can have grave consequences leading to widespread panic and amplification of the threat of the pandemic itself. As per a recent BBC report from August 2020, at least 800 people may have died around the world because of coronavirus-related misinformation in the first three months of this year. It is therefore of paramount importance to limit the spread of fake news and ensure that accurate knowledge is disseminated to the public. In this blog, we explore the problem of fake news detection related to COVID-19 and describe our approach to tackle it using Natural Language Processing. This is based on our recent paper — ‘Two Stage Transformer Model for COVID-19 Fake News Detection and Fact Checking’, accepted at the NLP for Internet Freedom Workshop, co-located with COLING2020. Our NLP solution: We built a topical fake news detection system capable of verifying claims as well as providing explanations, all in real-time. Developing a solution for such a task involves generating a database of factual explanations, which constitutes our knowledge base, that serves as ground truth for any given claim. We computed the entailment between any given claim and explanation to verify whether the claim is true or not. Querying for claim-explanation pairs for each explanation in our knowledge base is computationally expensive and slow, so we propose generating a set of candidate explanations that are contextually similar to the claim. We achieved this by using a model trained with relevant and irrelevant claim-explanation pairs and using a similarity metric between the two to match them. Previous research on fake news detection Previous work on fake news detection has primarily focused on evaluating the relationship measured via a textual entailment task between a header and the body of the article. Researchers have explored the use of simple classifier models with TF-IDF features and cosine similarity metric to classify fake news. Several baselines with such methods exist on standard datasets like FNC-1 and FEVER. Transformer based pre-trained models achieved state of the art results in several NLP subtasks, their ease of fine-tuning makes them adaptable to newer tasks. In further related work, the authors proposed a model based on the BERT architecture to detect fake news by analyzing the contextual relationship between the headline and the body text of news. They further enhanced their model performance by pre-training with domain-specific news and articles. The use of social media has also been extensively studied for stopping misinformation for Covid-19. In a related work to this, authors developed an Infodemic Risk Index (IRI) after analyzing Twitter posts across various languages and calculated the rate at which a particular user from a locality comes across unreliable posts from different classes of users like verified humans, unverified humans, verified bots and unverified bots. But none of these mentioned works tackles the problem of misinformation by reasoning out the given fake claim with an explanation. Datasets: The use of an existing misinformation dataset would not serve as a reliable knowledge base for training and evaluating the models due to the recent and uncommon nature i.e., the vocabulary used to describe the disease and the terms associated with the COVID-19 pandemic. It was therefore important to generate real and timely datasets to ensure accurate and consistent evaluation of the methods. To overcome this drawback, we manually curated a dataset specific to COVID-19. Our proposed dataset consists of 5500 claim and explanation pairs. There are multiple sources on the web that are regularly identifying and debunking fake news on COVID-19. We collected data from “Poynter”, a fact checking website which collects fake news and debunks or fact-checks them with supporting articles from more than 70 countries. For each fact check, we collected only the ”claim” and the corresponding “explanation” from this database which were rated as ’False’ or ’Misleading’. In this way, we collected about 5500 false-claim and explanation pairs. We further manually rephrased a few of these false claims to generate a true claim, as the ones that aligned with the explanation, so as to create an equal proportion of true-claim and explanation pairs. Model Architecture: The architecture consists of a two stage model, we will refer to the first model as “Model A” and the second model as “Model B”. The objective of Model A is to fetch the candidate “true facts” or explanations for a given claim, which are then evaluated for entailment using Model B. Model A is trained on all claim-explanation pairs, as we have a lot more of them, and the task of the Model A is to pick out candidate claims for a given explanation. Model A is trained on a Next Sentence Prediction (NSP) task. Through our experiments, we find that, on this trained model, if we generate embeddings for a single sentence (either claim or explanation individually) and compare matching [claim, explanation] embeddings using the cosine similarity metric, there is a distinction in the distribution of similarity scores between related and unrelated [claim, explanation] pairs. Therefore, for faster near real-time performance, we cache the embeddings for all our explanations (knowledge base) beforehand and compute the cosine similarity between the claim and the cached embeddings of the explanations. We fetch the top explanations for any given claim exceeding a certain threshold of sentence similarity as there could be several explanations relevant for a given claim. The second part of the pipeline is to identify the veracity of a given claim. Model A fetches the candidate explanations while Model B is used to verify whether the given claim aligns with our set of candidate explanations or not. To train Model B, we use a smaller subset of “false claim” and “explanation” pairs from our original dataset, and cross-validate each sample with “true claim” or in other words, claims that align with the factual explanation. However, this small annotated data is not sufficient to train the model effectively. Therefore, the parameters of the Model A, which was trained on a much larger dataset were used as initial parameters for Model B, and fine-tuned further using our cross-validated dataset. Model B is also trained for the sequence classification task. Essentially Model B computes the entailment between its input claim, explanations pairs. We trained and evaluated both Model A and Model B using several approaches based on classical NLP methods as well as more sophisticated pre-trained Transformer models. The flow of the Model A + Model B pipeline is shown in the above figure. Transformer based Models: We trained and evaluated three Transformer based pre-trained models for both Model A and Model B using the training strategy described before. As our focus was to ensure that the proposed pipeline can be deployed effectively in a near real-time scenario, we restricted our experiments to models that could efficiently be deployed using inexpensive compute. We chose the following three models — BERT(base), ALBERT, and MobileBERT. Model A was trained on 5000 claim-explanation pairs on the sequence classification task to optimize the softmax cross entropy loss. This trained model was then validated on a test set comprising 1000 unseen claim-explanation pairs. The training data structure here looks like this. [claim, relevant explanation, 1], [claim, irrelevant explanation, 0] Model B was trained on a smaller subset of 800 cross-validated [claim, explanation, label] data, on the same sequence classification task, where the label was assigned based on whether the claim aligned with the explanation — 1 or not — 0. This was validated on 200 unseen data-points. The loss function used was softmax cross-entropy. The training data structure here looks like: [true claim, relevant explanation, 1] [false claim, relevant explanation, 0] For baselining we implement classical NLP approaches in our use-case and compare those results with transformer based models. We implement GLoVeand TF-IDF architectures for the classical ones. Evaluation metrics: For evaluating the performance of the overall pipeline model, we first evaluate the performance of Model A in its ability to retrieve relevant explanations. For this we use Mean Reciprocal Rank(MRR) and Mean Recall@10, that is, the proportion of claims for which the relevant explanation was present in the top 10 most contextual explanation by cosine similarity and their mean inverse rank. Once, Model A has retrieved relevant explanations, we evaluate the performance of Model B on computing the veracity of the claim. Here, we only used explanations that exceed an empirically defined threshold in cosine similarity between the query claim and the explanation. Through our experiments, we found that a threshold of the mean standard deviation of cosine similarity over the validation data worked well for picking relevant explanations. For evaluating the accuracy, we take a mean of the output probabilities for each claim, explanationᵢ. This is expected due to the lower parameter size of the TF-IDF and GloVe models. Among the Transformer based models, MobileBERT had the least latency per claim as expected while ALBERT consumed the least memory. The best performing BERT+ALBERT model utilized a memory of 1398MB and fetched relevant explanations of each claim in 2.471 seconds. The model latencies and memory usage were evaluated on an Intel Xeon — 2.3GHz Single-core — 2 thread CPU. Observations: We however do acknowledge that our models could still make errors of two kinds: Firstly, Model A might not fetch a relevant explanation which automatically means that the prediction provided by Model B is irrelevant, and secondly, Model A might have fetched the correct explanation(s) but Model B classifies it incorrectly. We show some of the errors our models made in this table. Conclusions: In this work, we have demonstrated the use and effectiveness of pre-trained Transformer based language models in retrieving and classifying fake news in a highly specialized domain of COVID-19. Our proposed two stage model performs significantly better than other baseline NLP approaches. Our knowledge base, which we prepare through collecting factual data from reliable sources from the web can be dynamic and change to a large extent, without having to retrain our models again for as long as the distribution is consistent. All of our proposed models can run in near real-time with moderately inexpensive compute. Our work is based on the assumption that our knowledge base is accurate and timely. This assumption might not always be true in a scenario such as COVID-19 where “facts” are changing as we learn more about the virus and its effects. Therefore a more systematic approach is needed for retrieving and classifying claims using this dynamic knowledge base. Future Work: Our future work consists of weighting our knowledge base on the basis of the duration of the claims and benchmarking each claim against novel sources of ground truth. Our model performance can be further boosted by better pre-training, through domain specific knowledge. In one of the more recent work, the authors propose a novel semantic textual similarity dataset specific to COVID-19. Pre-training our models using such specific datasets could help in a better understanding of the domain and ultimately better performance. Fake news and misinformation is an increasingly important and difficult problem to solve, especially in an unforeseen situation like the COVID-19 pandemic. Leveraging state of the art machine learning and deep learning algorithms along with preparation and curation of novel datasets can help address the challenge of fake news related to COVID-19 and other public health crises. Published in Towards Data Science Introduction
In recent years, the amount of data powering different industries, and their systems has been increasing exponentially. Majority of business information is stored in the form of relational databases that store, process, and retrieve data. Databases power information systems across multiple industries, for instance, consumer tech (e.g. orders, cancellations, refunds), supply chain (e.g. raw materials, stocks, vendors), healthcare (e.g. medical records), finance (e.g. financial business metrics), customer support, search engines, and much more. It is imperative for modern data-driven companies to track the real-time state of its business in order to quickly understand and diagnose any emerging issues, trends, or anomalies in the data and take immediate corrective actions. This work is usually performed manually by business analysts who compose complex queries in declarative query languages like SQL to derive business insights stored in multiple tables. These results are typically processed in the form of charts or graphs to enable leadership teams to quickly visualize the results and facilitate data-driven decision making. Although the most common SQL queries that address fundamental business metrics are predefined and incorporated in commercial products like PowerBi that power insights into business metrics, any new or follow-up business queries still need to be manually coded by the analysts. Such static interactions between database queries and consumption of the corresponding results require time-consuming manual intervention and result in slow feedback cycles. It is vastly more efficient to have non-technical business leaders directly interact with the analytics tables via natural language queries that abstract away the underlying SQL code. Defining the SQL query requires a strong understanding of database schema, SQL syntax and can quickly get overwhelming for beginners and non-technical stakeholders. Efforts to bridge this communication gap have led to the development of a new type of processing called Natural Language Interface to Database (NLIDB). This natural search capability has become more popular over recent years as companies such as Microsoft [1][2], Salesforce [3][4], and others are developing similar technologies for Natural language (NL) to SQL (NL2SQL). The converted SQL could also enable virtual assistants like Alexa, Google Home, and others to improve their responses when the answer can be found in different databases or tables. This blog will review the challenges, evaluation methods, datasets, different approaches, and some state-of-the-art deep learning approaches for NL2SQL. 2. Technical challenges 2.1 Understanding NL query and aligning utterance with schemaThe system must understand both the user’s question and the table schemas (columns, table names, and values) to map the query to SQL correctly. A key challenge here is understanding the structured schema of DB tables (e.g., the name, data type, and stored values of columns) and the alignment between the input query and the schema. For instance, for the question, Which country has the largest GDP?, the model needs to map GDP to the Gross Domestic Product Column. Sometimes the question might also require understanding the semantics of a column rather than just column names. For the table and question shown in Figure 3, the Venue column used to answer the example question refers to host cities. Hence, the model needs to align “city” in the query with the venue column in the table. 2.2 Generalization to cross-domains Collecting large training data for different domains is expensive and non-scalable. Hence, it is important to train systems to generalize to different domains and databases. This generalization would involve identifying new entities, mapping unseen phrases and entities correctly in the SQL query, and handling novel database and query structures (larger tables, the composition of SQL components, etc.)[5]. 2.3 Order matters problem One of the standard ways to solve the NL2SQL tasks is to use seq2seq (since both NL query and SQL are sequences) models and their variants. One of the issues with this approach is that different SQL queries may be equivalent to each other due to commutative and associative properties. 3. Datasets There are several datasets for NL2SQL tasks. These contain annotated NL questions, SQL pairs corresponding to one or more tables. These datasets differ in terms of domains (single vs. cross-domain), size (number of queries — which is essential for proper model evaluation), and query complexity (single table vs. multi-table). The early datasets like ATIS, GeoQuery focus on single domains and are also limited in terms of the number of queries. Some of the latest datasets like WikiSQL, Spider are cross-domain, and context-independent with a larger size. One significant difference between WikiSQL and Spider is query complexity. Queries in WikiSQL are simpler (which only covers SELECT and WHERE clauses). Also, each database in WikiSQL is only a simple table without any foreign key. Spider contains a modest number of queries and includes complex questions that involve joins of tables and nested queries. The SParC[15] and CoSQL[16] are the extensions of the Spider dataset that are created for contextual cross-domain semantic parsing and conversational dialog text-to-SQL system. 4. Evaluation methods The most common methods to evaluate NL2SQL systems are execution accuracy and logical form accuracy. Execution accuracy compares the result after execution of the predicted SQL query with the result of the ground truth query. One downside of this method is that it is possible to have an unrelated SQL query that does not correspond to the question but still gives the right answer (for example, NULL result). Logical form accuracy compares the exact string match of predicted SQL query with the ground truth query. This metric has the limitation of incorrectly penalizing predictions that yield correct results upon execution but do not have an exact string match with a ground truth SQL query. One approach to solving the ordering issue is to canonicalize SQL queries before comparison [17]. SQL canonicalization is a method to make evaluations consistent by ordering columns in SELECT, tables in FROM, and WHERE constraints and standardizing table aliases, capitalization, and space between symbols. Authors of Spider [19] use component matching, which measures the average exact match between the prediction and ground truth on different SQL components like SELECT, WHERE, GROUP BY, etc. The prediction and ground truth is parsed and decomposed into subcomponents and then their exact match is calculated component-wise. For example, to evaluate the SELECT component: SELECT avg(col1), max(col2), min(col1) is decomposed to set (avg, min, col1), (max, col2) And then this set is compared with the ground truth sets. Even though this takes care of the ordering issue, it still does not account for when the prediction uses a different logic (compared to ground truth SQL) to arrive at the same result. Hence for a thorough evaluation, execution accuracy should also be used. The authors in [19] also categorize query by hardness based on the number of SQL components, selections, and conditions. This categorization can be very helpful for getting more insights about model performance with respect to query complexity. 5. Different approaches for NL2SQL 5.1 Rule-based approachesMost existing approaches focus on a rule-based parser for natural language combined with ambiguity detection. Some rule-based systems use trigger words to identify patterns in the user’s question. For example, “by” is a common word used in aggregation queries like “List the movies directed by <director>”. Here, the trigger word’s left side might have the keywords required for the SELECT clause, and the right side would have the necessary keywords for the GROUP BY clause. Despite its simplicity, this approach (if rules are well-formed) has been shown to handle a surprisingly broad type of queries. Modern conversational agents such as Siri and Cortana follow a similar principle, although the rules are not deterministic and based on training (logistic regression classifier of intent). 5.2 Grammar-based systemsIn Grammar-based systems, the user’s question is parsed, and the resulting parsed tree is directly mapped to expression in SQL. A grammar is created which can describe the possible syntactic structures of the user’s questions. The over-simplistic grammar shown in the figure considers the user’s question(S) to be composed of Noun Phrase and a Verb Phrase; Noun phrases consist of a Determiner followed by Noun, Determiner consists of the word “What” or “Which” etc. This grammar can then be used to parse a question like “Which rock contains magnesium?” into a parse tree and then map the resulting parse tree to SQL. This mapping back to SQL would be carried out by rules and based entirely on the parse tree’s syntactic information. 5.3 Deep Learning based-approachesRule-based approaches are limited in terms of coverage, scalability, and naturalness. They are also not robust to natural language diversity and are very difficult to scale across domains. The advent of large scale supervised datasets like WikiSQL, Spider, etc., and advances in Natural language processing, pretraining [20], etc. has enabled Deep learning models to achieve the state of the art results in NL2SQL tasks. Almost all the deep learning models generate the SQL query from natural language input with an encoder-decoder [21] model. The encoder could be RNN [22] / LSTM [24] or the recent transformer [25] networks. Most of the models differ in how they encode the schema (table names, column names, cell values, etc.) and how they produce the SQL output. Some models make schema as part of their output vocabulary. In other words, they put all the table names, column names, etc., into their output vocabulary, and while decoding the SQL output, they select these words from the vocabulary. NSP[10], DBPAL[18] are some of the methods which use this approach. One major limitation of this approach is we cannot adapt them to cross-domains as they do not encode new schemas in their input. In contrast, other methods like SEQ2SQL[3] use the schema as input to the model and while decoding, use the table or column names mentioned in the input using pointer networks [26]. For instance, in SEQ2SQL[3], the authors use column names, question tokens, and SQL tokens like SELECT, WHERE, COUNT, MIN, MAX, etc. as input. Their pointer network produces the SQL query by selecting exclusively from this augmented input sequence. The authors also claim that apart from limiting the output space, this augmented pointer network produces higher quality WHERE clauses. Based on the generation of SQL queries from natural language input, there exist three types of models: sequence to sequence, sequence to tree, and slot-filling[23]. The sequence to sequence models generates the SQL as a sequence of words. The sequence to tree models generates a syntax tree of the predicted SQL query. The slot-filling methods treat the SQL query as a set of slots and then decode the whole question using relevant decoders for each slot. An advantage of grammar-based decoders is that they can check for grammatical errors at every step, producing complex queries with joins, nested queries, etc. without any syntax errors. 5.4 Modern Deep Learning approaches Modern Deep Learning approaches use more techniques to learn joint representations over NL questions and structured information present in tables. They use various attention-based architectures for question/schema encoding and AST based structure architecture (sequence to tree) for query decoding. IRNet [1], RAT-SQL (current SOTA approach in spider) [2] use BERT[21] (for NL representation) along with in-house strategies to encode structured information in tables. In contrast, TaBERT[27] uses a general-purpose pretraining approach to learn representations of natural language sentences and tabular data. These techniques include schema linking, better schema encoding, using DB content (Cell values instead of just column and table names), contextualizing questions and schema representations. 5.4.1 Schema Linking This involves aligning the entity references in the question to the right schema columns or tables. Textual matches are the best evidence for question-schema alignment, and it might be directly beneficial to the encoder. Linking is generally done with string matching in IRNet and RAT-SQL. N-grams (up to lengths of 5 or 6) in the question are used to match (both exact matches and partial matches are considered) column or table names in the schema. After linking, IRNet tags each entity mentioned in the question with the type of the corresponding entity (table name/column name, etc.) while encoding. The column names are also assigned types EXACT MATCH and PARTIAL MATCH based on n-gram overlap with question words. RAT-SQL, on the other hand, constructs a graph with question words and the column/table names as the nodes and edges being QUESTION-COLUMN-M, QUESTION-TABLE-M, etc., where M is either one of EXACTMATCH, PARTIALMATCH, or NOMATCH. 5.4.2 Value-based linking The natural language question can also have value mentions (like ‘4’ in ‘For cars with 4 cylinders, which model has the largest horsepower’), which would be present as a cell value in some table. IRNet looks up the value mention from the question in a knowledge base and searches the results returned over the column names for partial or exact matches. The column names are assigned types VALUE EXACT MATCH and VALUE PARTIAL MATCH based on the match. RAT-SQL, on the other hand, adds an edge COLUMN-VALUE between question word and a column name if the question word occurs as a value in the column. TaBERT uses the DB content directly instead of linking and using the column name. The authors reason that contents provide more detail about a column’s semantics than just the column’s name, which might be ambiguous. They select a content snapshot consisting of only a few rows that are most relevant based on string matching (n-gram overlap) to the NL question. 5.4.3 Schema Encoding This involves encoding the relational structure in databases. It is much more challenging in databases with multi-table relations (where encoding primary, foreign keys, etc. are essential). IRNet encodes both the columns and tables to get column and row representations. The columns are represented by column name and their type, which is defined from schema linking. The final representations are created by adding the column name embeddings, context embeddings (based on n-grams matched in the question), and type embeddings. RAT-SQL represents the schema as a directed graph with columns and tables as nodes. The edges are defined by database relations detailed in the above diagram. 5.4.4 Contextualizing question and schema representations This helps in learning effective joint representations. RAT-SQL augments their schema graph by adding edges between question words and schema entities defined after schema linking. They introduce a relation-aware self-attention[25] layer to use the relational structure in the input and also learn “soft” relations between the sequence elements. They do this by providing a way to communicate known relations (like primary key, foreign keys, etc. defined in edge labels) by adding their representations to the attention. 6. Conclusions and Future trends In this blog, we reviewed the state-of-the-art in NL2SQL — the problem statement, challenges, evaluation of such systems, and the modern machine learning techniques for solving the task. Recent work also focuses on improving the user experience while using such systems. Photon [4] is a flexible system that supports both NL questions and SQL as input. It also has a confusion detection module that detects unanswerable questions and helps users paraphrase a question to get the right answers. Authors in [28] also show that incorporating human feedback can further improve the accuracy and user experience of these systems. Although modern NL2SQL techniques achieve good accuracy on benchmark test sets, they are still far from demonstrating robust performance in production settings. In the context of business decision making, it is critical to achieving reliable performance to foster and build users’ trust in such systems. NL2SQL methods have the potential to significantly enhance the efficiency of human analysts so they can focus more time on contextual interpretation and validation of results. The output of modern end-to-end deep learning systems suffer from a lack of interpretability, and while there is significant research on how AI systems work under the hood, incorporating humans-in-the-loop to provide feedback and improve the predictive power will accelerate the adoption and use of NL2SQL systems across the modern data-driven organizations. 7. References [1] Guo, Jiaqi, et al. “Towards complex text-to-sql in cross-domain database with intermediate representation.” (2019) arXiv preprint arXiv:1905.08205 [2] Wang, Bailin, et al. “Rat-sql: Relation-aware schema encoding and linking for text-to-sql parsers.” (2019) arXiv preprint arXiv:1911.04942 [3] Zhong, Victor, Caiming Xiong, and Richard Socher. “Seq2sql: Generating structured queries from natural language using reinforcement learning.” (2017) arXiv preprint arXiv:1709.00103 [4] Zeng, Jichuan, et al. “Photon: A Robust Cross-Domain Text-to-SQL System.” (2020) arXiv preprint arXiv:2007.15280 [5] Suhr, Alane, et al. “Exploring Unexplored Generalization Challenges for Cross-Database Semantic Parsing.” (2020) Proceedings of the 58th Annual Meeting of the Association for Computational Linguistics. [6] Dahl, Deborah A., et al. “Expanding the scope of the ATIS task: The ATIS-3 corpus.”(1994) HUMAN LANGUAGE TECHNOLOGY: Proceedings of a Workshop held at Plainsboro, New Jersey, March 8–11, 1994. [7] Tang, Lappoon R., and Raymond J. Mooney. “Using multiple clause constructors in inductive logic programming for semantic parsing.”(2001) European Conference on Machine Learning. Springer, Berlin, Heidelberg, 2001. [8] Tang, Lappoon R., and Raymond Mooney. “Automated construction of database interfaces: Integrating statistical and relational learning for semantic parsing.” (2000) Joint SIGDAT Conference on Empirical Methods in Natural Language Processing and Very Large Corpora. [9] Li, Fei, and H. V. Jagadish. “Constructing an interactive natural language interface for relational databases.” (2014) Proceedings of the VLDB Endowment 8.1: 73–84. [10] Iyer, Srinivasan, et al. “Learning a neural semantic parser from user feedback.” (2017) arXiv preprint arXiv:1704.08760 [11] Yaghmazadeh, Navid, et al. “SQLizer: query synthesis from natural language.” (2017) Proceedings of the ACM on Programming Languages 1.OOPSLA: 1–26. [12] Zhong, Victor, Caiming Xiong, and Richard Socher. “Seq2sql: Generating structured queries from natural language using reinforcement learning.” (2017) arXiv preprint arXiv:1709.00103 [13] Finegan-Dollak, Catherine, et al. “Improving text-to-sql evaluation methodology.” (2018) arXiv preprint arXiv:1806.09029 [14] Yu, Tao, et al. “Spider: A large-scale human-labeled dataset for complex and cross-domain semantic parsing and text-to-sql task.” (2018) arXiv preprint arXiv:1809.08887 [15] Yu, Tao, et al. “Sparc: Cross-domain semantic parsing in context.” (2019) arXiv preprint arXiv:1906.02285 [16] Yu, Tao, et al. “Cosql: A conversational text-to-sql challenge towards cross-domain natural language interfaces to databases.” (2019) arXiv preprint arXiv:1909.05378 [17] Finegan-Dollak, Catherine, et al. “Improving text-to-sql evaluation methodology.” (2018) arXiv preprint arXiv:1806.09029 [18] Basik, Fuat, et al. “Dbpal: A learned nl-interface for databases.” (2018) Proceedings of the 2018 International Conference on Management of Data [19] Yu, Tao, et al. “Spider: A large-scale human-labeled dataset for complex and cross-domain semantic parsing and text-to-sql task.” (2018) arXiv preprint arXiv:1809.08887 [20] Devlin, Jacob, et al. “Bert: Pre-training of deep bidirectional transformers for language understanding.” (2018) arXiv preprint arXiv:1810.04805 [21] Sutskever, Ilya, Oriol Vinyals, and Quoc V. Le. “Sequence to sequence learning with neural networks.” (2014) Advances in neural information processing systems. [22] Williams, Ronald J.; Hinton, Geoffrey E.; Rumelhart, David E. “Learning representations by back-propagating errors”. (October 1986) Nature. [23] Kim, Hyeonji, et al. “Natural language to SQL: where are we today?.” (2020) Proceedings of the VLDB Endowment 13.10: 1737–1750. [24] Hochreiter, Sepp; Schmidhuber, Jürgen “Long Short-Term Memory”. (1997–11–01) Neural Computation. [25] Vaswani, Ashish, et al. “Attention is all you need.” (2017) Advances in neural information processing systems. [26] Vinyals, Oriol, Meire Fortunato, and Navdeep Jaitly. “Pointer networks.” (2015) Advances in neural information processing systems. [27] Yin, Pengcheng, et al. “TaBERT: Pretraining for Joint Understanding of Textual and Tabular Data.” (2020) arXiv preprint arXiv:2005.08314 [28] Elgohary, Ahmed, Saghar Hosseini, and Ahmed Hassan Awadallah. “Speak to your Parser: Interactive Text-to-SQL with Natural Language Feedback.” (2020) arXiv preprint arXiv:2005.02539 |
Archives
March 2024
Categories
All
Copyright © 2024, Sundeep Teki
All rights reserved. No part of these articles may be reproduced, distributed, or transmitted in any form or by any means, including electronic or mechanical methods, without the prior written permission of the author. Disclaimer
This is a personal blog. Any views or opinions represented in this blog are personal and belong solely to the blog owner and do not represent those of people, institutions or organizations that the owner may or may not be associated with in professional or personal capacity, unless explicitly stated. |
 RSS Feed